Contextual clothing for naked transparency

The other day I listened to a Spark (CBC Radio) interview with Larry Lessig about his New Republic essay Against Transparency, which begins:

We are not thinking critically enough about where and when transparency works, and where and when it may lead to confusion, or to worse. And I fear that the inevitable success of this movement–if pursued alone, without any sensitivity to the full complexity of the idea of perfect openness–will inspire not reform, but disgust. The “naked transparency movement,” as I will call it here, is not going to inspire change. It will simply push any faith in our political system over the cliff.

The essay was published in October 2009. In this interview from November, Prof. Lessig reflected on the reactions that it provoked. Although the delicious and bitly feedback now suggests that most people understood the essay to be a thoughtfully nuanced critique, there were evidently some early responders who read it as a retreat from openness and an assault on the Internet.

I’m glad I missed the essay when it first appeared. Reading it along with a cloud of feedback from readers and from the author amplifies one of the key points: We don’t really want naked transparency, we want transparency clothed in context.

The Net can be an engine for context assembly, a wonderful phrase I picked up years ago from Jack Ozzie and echoed in several essays. But it can also be a context destroyer.

In the interview, Lessig notes one example of context destruction. The article, which most people will read online, spans eleven pages, each of which wraps its nugget of “content” in layers of distraction. Some early negative comments, Lessig says, came from people who had clearly not read to the end.

Our increasingly compressed and fragmented attention can also be a context destroyer:

What about when the claims are neither true nor false? Or worse, when the claims actually require more than the 140 characters in a tweet?

This is the problem of attention-span. To understand something–an essay, an argument, a proof of innocence– requires a certain amount of attention. But on many issues, the average, or even rational, amount of attention given to understand many of these correlations, and their defamatory implications, is almost always less than the amount of time required. The result is a systemic misunderstanding–at least if the story is reported in a context, or in a manner, that does not neutralize such misunderstanding. The listing and correlating of data hardly qualifies as such a context. Understanding how and why some stories will be understood, or not understood, provides the key to grasping what is wrong with the tyranny of transparency.

Transparency is a necessary but not a sufficient condition. Recently my town’s crime data and council meetings have appeared online. But this remarkable transparency does not alone enable the sort of collaborative sense-making that we all rightly envision.

In the case of crime data, we require a context that includes historical trends, regional and national comparisons, guidance from government about how its local taxonomy relates to regional and national taxonomies, and reporting by newspapers and citizens.

In the case of city council meetings, we require a context that includes relevant state law and local code, and reporting by stakeholders, by newspapers, and by affected citizens.

To enable context assembly, we’ll need to organize the numeric and narrative data produced by the “naked transparency” movement in ways friendly to linking, aggregation, and discovery.

But these principles will need to be adopted more broadly than by governments alone. Everyone needs to understand the principles of linking, aggregation, and discovery, so that everyone can help create the context we crave.

Carbon theater

Borrowing Bruce Schneier’s wonderful term security theater, Rohit Khare has written about privacy theater. Not to be outdone, here’s a letter to my local newspaper about carbon theater.


To: Editors
Re: Carbon challenge in home stretch

We love our sports rivalries, and the classic contest between Keene and Portsmouth has riveted me to my sofa. Let’s recap. Back in April, seacoastonline.com (http://www.seacoastonline.com/articles/20090423-NEWS-904230413) reported:

Municipal employees in Portsmouth and Keene, the state’s two predominant ‘green’ cities, slugged it out over the course of three weeks and, in the end, Keene delivered the knockout punch.

This week, the Sentinel and the Portsmouth Herald advanced the story of this “carbon-busting throwdown” in a joint communique (http://keenesentinel.com/articles/2009/12/29/news/local/free/id_384393.txt):

Garry Dow of Clean Air-Cool Planet, which manages the carbon challenge, said the scales are tipped in Portsmouth’s favor in the second phase, which involves the number of residents in each city to sign up for the challenge.

The challenge? Check it out at http://necarbonchallenge.org/calculator.jsp. There you will find an online form that reminds you to tighten up your house, use compact fluorescent lights, air-dry your dishes, and recycle.

Back in April, more of Keene’s city employees took the survey than Portsmouth’s. But now, in phase two of the carbon-busting throwdown, Portsmouthians are taking the survey at a higher rate than Keeners.

Across New England, according to the Carbon Challenge website, this slugfest has reduced C02 emissions by over 17 million pounds. That’s nothing to sneeze at. It’s two thirds of New York City’s daily waste stream, a third of the mass of the Titanic, a fifth of the C02 produced by the recent Copenhagen conference.

Except, of course, none of the combatants has actually reduced their C02 emissions. They’ve only take an online survey, and pledged to do all sorts of things that might or might not get done.

I’d like to propose a different challenge. Let’s focus on one thing and really get it done. For example, what if every leaky window in Keene were equipped with an interior storm? John Leeke, who runs Historic HomeWorks in Portland, invented this cheap, appropriate, and effective technology. On his website (http://www.historichomeworks.com/forum/viewtopic.php?t=193) he shows how to build interior storms.

I’ve done this, and it’s a vast improvement over the stick-on window kits I’ve used in previous years. Interior storms are just cheap wooden frames with gaskets around the outside and shrink-wrap plastic facing. They press-fit into your window frames from the inside. You get all the benefits of the stick-on kits: zero air infiltration, a second layer of dead air. And there are none of the drawbacks: awkward yearly installation, destructive yearly removal.

“Keene’s down in the standings,” the Sentinel/Herald article says, “but there’s still plenty of time for residents to take the online survey and boost the city’s chance to take home the green prize.”

Well, OK, but I’d like to see Keene define — and then win — a different prize. What if we become the first city to outfit every leaky window in town with an interior storm? And what if we create jobs while doing so? That would be something worth shouting about.

Gov2.0 transparency: An enabler for collaborative sense-making

Recently my town has adopted two innovative web services that I’ve featured on my podcast: CrimeReports.com, which does what its name suggests, and Granicus.com, which delivers video of city council meetings along with synchronized documents.

You can see the Keene instance of CrimeReports here, and our Granicus instance here.

I’m delighted to finally become a user of these systems that I’ve advocated for, written about, and podcasted. I’m also eager to move forward. We’re still only scratching the surface of what Net-mediated democracy can and should become.

In the case of CrimeReports, the next step is clear: Publish the data. It’s nice to see pushpins on a map, but when you’re trying to answer questions — like “Are we having a crime wave?” — you need access to the information that drives the map. Greg Whisenant, the founder of CrimeReports.com, says he’d be happy to publish feeds. But so far the cities that hire him to do canned visualizations of crime data aren’t asking him to do so, because most people aren’t yet asking their city governments to provide source data. So a few intrepid hackers, like Ben Caulfield here in Keene, are reverse-engineering PDF files to get at the information. Check out Ben’s remixed police blotter — it’s awesome. Now imagine what Ben might accomplish if he hadn’t needed to move mountains to uncover the data.

In the case of Granicus, I’m reminded of this item from last year: Net-enhanced democracy: Amazing progress, solvable challenges. The gist of that item was that:

  • It’s amazing to be able to observe the processes of government.

  • It’s still a challenge to make sense of them.

  • Tools that we know how to build and use can help us meet that challenge.

Check out, for example, last week’s Keene city council meeting. Scroll down to an item labeled 2. Ordinance O-2009-21. In this clip, the council agrees to amend the city code for residential real estate tax exemptions. I wish I could link you directly to that portion of the video, which begins at 34:11, in the same way that I can link you to the associated document. But more broadly, I wish that a citizen who tunes in could understand — and help establish — the context for this amendment.

Here’s the new language:

Sec. 86-29 Residential real estate tax exemptions and credits

With regard to property tax exemptions, the city hereby adopts the provisions of RSA 72:37 (Blind); RSA 72:37-b (Disabled); RSA 72:38-b (Deaf or Severely Hearing Impaired); RSA 72:39-a (Elderly); RSA 72:62 (Solar); RSA 72:66 (Wind); and RSA 72:70 (Wood).

With regard to property tax credits, the city hereby adopts the provisions of RSA 72:28, II, (Optional Veterans’ tax credit); RSA 72:29-a , II, (Surviving Spouse); and RSA 72:35, I-a, (Optional Tax Credit for Service-Connected total disability).

In this case, I just happen to know a bit of this amendment’s backstory. Earlier this year I found out — only thanks to a serendipitous encounter with a city councilor at a social event — that my wood gasifier qualified me for an exemption. This was the first such exemption, and to my knowledge is still the only one granted.

If I hadn’t gone through that experience, though, the video clip and its associated document would mean nothing to me. There would be no way to make a connection between state law on the one hand, and a documented case study on the other.

On the next turn of the crank, I hope that services like Granicus will enable us to make those connections. Seeing the process of government in action is a great step forward. Now we need to be able to use links and annotations to help one another make sense of that process.

Talking with Howard Eglowstein about micro-CHP and the maker renaissance

My guest for this week’s Innovators show is my old BYTE pal Howard Eglowstein. Nowadays he’s working for freewatt, a residential micro-CHP (combined heat and power) system, and our conversation revolved partly around that technology.

But I also invited Howard to reflect on the cultural phenomenon that’s celebrated in the pages of Make. Hacking at the intersection of atoms and bits is nothing new for Howard, he’s been doing it his whole career. One of his epic projects was Thumper, a machine he built for the BYTE lab to test the battery life of notebook computers. Thumper used optical sensors to notice when power-saving features kicked in, and robotic fingers to defeat them by pressing keys. (I resurrected this article about Thumper from the (now-abandoned) BYTE archive.)

It makes perfect sense for Howard to be deploying his hybrid skillset in the realm of energy innovation. But why, I’ve wondered lately, did we devalue those skills and inclinations? Why the long lull between the heydays of Popular Mechanics and Make? Here are some of Howard’s observations:

On toys, cars, and patents:

My background is in electronic toys. Toy engineers know how to take a really cool concept and make it cheap. In the 80s — not so much any more — you could get something at the toy store, open it up with a Dremel, and make it do something different. That’s how some kids get their first taste of reverse engineering.

But how many of us can fix our cars anymore? You just can’t. Even car people don’t have the tool and the documentation. A lot of things are done better than everybody else, and they’re secret.

In the toy industry we never patented anything, there was no point. If you patent something you have to tell everybody how it works, and then they have what they need to make an improvement and then steal the idea from you. So you do something amazing and cool, you wow everybody, and by the time they figure out what you’ve done you’ve moved on to something else which is even cooler.

On a friend’s son who is a Make fan:

We’ve really encouraged people to absorb information. But that gets boring after a while. You browse the computer, it’s kind of fun to click on links and see where they go, but it gets old. Meanwhile we’ve got a lot of kids who, let’s face it, probably aren’t going to get together and throw a football around, they’d rather play video games. So in this kid’s case when he gets tired of looking at stuff he goes and builds stuff. I hope that we’re encouraging more people to do that.

After speaking with Howard I was reminded of one project that is providing that encouragement: Natalie Jeremijenko’s feral robotic dogs, which are “upgraded commercially robotic dog toys that have been transformed into activist instruments to find and display urban pollutants.”

So I guess the toy business still is giving some young people their first taste of reverse engineering!

Computational thinking and energy literacy

One of the themes I’ve been exploring for the past few years is computational thinking. It’s an evocative phrase that has led me in a few different directions. One is my intentional use of tagging and syndication as key strategies for social information management. Another is my growing interest in the kinds of uses of WolframAlpha outlined in Kill-A-Watt, WolframAlpha, and the itemized electric bill.

A lot of what I’ve read and heard about WolframAlpha seems to focus on its encyclopedic nature. But it aims to be a compendium of computable knowledge, and as such I think its highest and best use will be to enable computational thinking.

Here’s one small but telling example from my Kill-A-Watt essay:

Q: 9 W * (30 * 24 hours)

A: About half the energy released by combustion of one kilogram of gasoline.

Q: ( 1 kilogram / density of gasoline ) / 2

A: Less than a fifth of a gallon.

I was trying to understand what 9 Watts, over the course of a month, means. WA offered the comparison to the amount of energy in gasoline, but reported in kilograms. I still think in gallons. The conversion is:

( 1 kg / .73 kg/L) / 2 = .685L * .264 gallons / L = .18 gallons

If you don’t do that kind of thing on a regular basis, though — as I don’t, and as many of us don’t — it’s hard to get over the activation threshold. Looking up and applying the relevant formulae is a multistep procedure. WA collapses it into a single step:

( 1 kilogram / density of gasoline ) / 2

It knows the density of gasoline, and when you do the computation it reports results in a variety of units, including gallons.

I was feeling a bit guilty about needing this sort of intellectual crutch. But then I heard from a friend who had just read the Kill-A-Watt/WA piece. It reminded him of an Energy Tribune article entitled Understanding E=mc2 which concludes:

A 1000-MW coal plant — our standard candle — is fed by a 110-car “unit train” arriving at the plant every 30 hours — 300 times a year. Each individual coal car weighs 100 tons and produces 20 minutes of electricity. We are currently straining the capacity of the railroad system moving all this coal around the country. (In China, it has completely broken down.)

A nuclear reactor, on the other hand, refuels when a fleet of six tractor-trailers arrives at the plant with a load of fuel rods once every eighteen months. The fuel rods are only mildly radioactive and can be handled with gloves. They will sit in the reactor for five years. After those five years, about six ounces of matter will be completely transformed into energy. Yet because of the power of E = mc2, the metamorphosis of six ounces of matter will be enough to power the city of San Francisco for five years.

This is what people finds hard to grasp. It is almost beyond our comprehension. How can we run an entire city for five years on six ounces of matter with almost no environmental impact? It all seems so incomprehensible that we make up problems in order to make things seem normal again. A reactor is a bomb waiting to go off. The waste lasts forever, what will we ever do with it? There is something sinister about drawing power from the nucleus of the atom. The technology is beyond human capabilities.

But the technology is not beyond human capabilities. Nor is there anything sinister about nuclear power. It is just beyond anything we ever imagined before the beginning of the 20th century. In the opening years of the 21st century, it is time to start imagining it.

Six ounces of matter? Really? My friend wrote:

I remember at the time I tried to run simple order of magnitude calculations in my head to verify the number, but it got messy, I got sidetracked, and forgot.

This time I went to Wolfram-Alpha, and the answer was right there, clear as day, in seconds (and yes, it’s really 6 ounces of matter).

I went back to the article, and the only quantity of energy reported for San Francisco was that Hetch Hetchy Dam “provides drinking water and 400 megawatts of electricity to San Francisco.” That alone would come to:

400MW * 5 years = ~700 grams = ~25 ounces

Or, if Wikipedia is right and the dam yields only about 220MW, then:

220MW * 5 years = ~386 grams = ~14 ounces

Of course since San Francisco has other sources of power, the amount of matter would be more. Still, this doesn’t invalidate the author’s point: we’re talking ounces, not tons.

When I mentioned this to my friend, though, he wrote back:

I went the other way around:

http://www.wolframalpha.com/input/?i=6oz * c^e2 in gw hr

It gives 4247 GWhr which is definitely in the ballpark for San Francisco.

Sweet!

I didn’t actually follow up on that result just now, but over 5 years it comes to:

http://www.wolframalpha.com/input/?i=4247GWh / 5 years = ~100MW. That’s a quarter of what the article reports for Hetch Hetchy, it’s half what Wikipedia reports, and I still don’t know how it relates to San Francisco’s total power draw.

Even so, we’re playing in the kind of ballpark we need to be able to play in if we’re going to have any kind of reasoned discussion about future energy mixes like Saul Griffith’s straw-man proposal of:

2TW Solar thermal, 2TW Solar PV, 2TW wind, 2TW geothermal, 3TW nukes, 0.5TW biofuels

What I find most striking about the energy literacy talks that Saul’s been giving lately is his ability to move fluidly between the personal quantities of energy we experience directly, the city-scale quantities we experience indirectly, and the global quantities that most of us can scarcely imagine.

My point here isn’t to revisit the dispute that Stewart Brand and Amory Lovins are having about the future role of nuclear power. Nor to endorse William Tucker, the author of that Energy Tribune article, who is a journalist not a scientist or an engineer, and whose argument fails to address issues of security and waste disposal.

Instead I want to focus on how mental power tools like WolframAlpha, by making computable knowledge easier to access and manipulate, can augment our ability to think computationally. If we’re going to reason democratically about the energy, climate, and economic challenges we face, we’re going to need those power tools to be available broadly and used well.

Talking with Randy Julian about bioinformatics

My guest for this week’s Innovators show, Randy Julian, founded the bioinformatics company Indigo BioSystems to help modernize the process of drug discovery. The challenge — and opportunity — is partly to standardize the data formats used to represent experimental data, and to locate that data in shared spaces where it can be linked and recombined.

There’s also the crucial issue of reproducibility. One requirement, as Victoria Stodden said in my conversation with her, is to publish not just data but also the code that processes the data, ideally in an environment where data-transforming computation can be replayed and verified. One of the ways Indigo’s system does that is by hosting instances of R, the wildly popular statistical programming system, in the cloud.

Another key requirement for reproducing an experiment, Randy Julian says, is a robust and machine-readable representation of the design of the experiment. If I don’t know what you’re trying to prove, and how you’re trying to prove it, your data are just numbers to me. If I do know those things, I may be able to verify your results. And we may be able to automate more of the work using machine intelligence and machine labor — a vision that also inspires Jean-Claude Bradley, Cameron Neylon, and others to pursue open-notebook science.

A new validator for iCalendar

In January 2009 I wrote a series of entries [1, 2, 3] documenting examples of ill-formed iCalendar files. And I argued that we need an analog, in calendar space, to the incredibly useful RSS/Atom feed validator.

I’m delighted to report that Doug Day has taken up the challenge. The first incarnation of his validator is up and running at http://icalvalid.cloudapp.net. It’s based on Doug’s DDay.iCal, which is the same .NET-based iCalendar class library used by the elmcity aggregator. But, like the RSS/Atom validator, it’s driven by an extensible and language-independent suite of tests.

The validator reports numerical scores for an iCalendar file, and gives advice about how it will be handled by popular calendar applications. Some examples:

The Keene High Varsity Basketball schedule scores a 96.25: “This calendar has minor problems, but will likely work correctly in major calendar applications.”

The Hannah Grimes Center’s calendar, based on Drupal, scores 92.5: “This calendar has moderate problems, but may work correctly in major calendar applications.”

The Keene Chamber of Commerce calendar scores 0: “This calendar has severe problems; very few (if any) applications will accept this calendar.” (DDay.iCal does, in fact, overlook these problems, and does parse events from this calendar.)

I’m hugely grateful to Doug Day for doing this important work. Although calendars seem to be ubiquitous, familiar, and interoperable, the examples I’ve been collecting in the wild show that, even though the standard has been around for over a decade, the iCalendar ecosystem is still very immature. This validator will help that ecosystem evolve.

The validator itself, of course, will also evolve. You can send feedback to Doug at the address given on its home page. If you’re curating a location or a topic using the elmcity service, you can email me about problem calendars or bring them to the curators’ room.

Stewart Brand’s Whole Earth Discipline

I’ve deeply enjoyed every one of the Long Now seminars, but it wasn’t until this one by Stewart Brand in October that I really got what he’s up to as the convener of this remarkable series of talks. In October he appeared as speaker rather than host/interviewer, and he summarized his new book Whole Earth Discipline. Kevin Kelly calls the book “a short course on how to change your mind intelligently” — in this case, about cities, nuclear power, and genetic and planetary engineering. These are all things that Steward Brand once regarded with suspicion but now sees as crucial tools for a sustainable world.

The book weaves together insights from many of my favorite Long Now talks, including:

I guess the Long Now seminars is the long version of a course on changing your mind. I was already on board with genetic and planetary engineering, but now I think very differently about cities and nuclear power. The book joins these to a common principle: concentrate the harmful stuff. High-density populations and casks of nuclear waste do less harm than scattered populations and dispersed coal residue.

Don’t miss the annotations — a website that reproduces every paragraph that includes citations, links to their sources, and adds updates.

Kill-A-Watt, WolframAlpha, and the itemized electric bill

I’ve always imagined getting an itemized electric bill. We’re not there yet, but when I saw a Kill-A-Watt at Radio Shack last night I remembered the discussion thread at this 2007 blog post and impulsively bought it.

In a way I’m glad I waited until 2009 because a companion tool is available now that wasn’t then: WolframAlpha. Its fluency with units, conversions, and comparisons is really helpful if, like me, you can’t do that stuff quickly and easily in your head.

So, for example, I’m sitting at my desk with the Kill-A-Watt watching my main power strip. I have a mixer here that I use about an hour a week for podcast recording. There’s no power switch because, well, why bother, just leave it on, it’s a tiny draw. Negligible.

I reach over and unplug it. Now I’m drawing 9 fewer watts. But what does that mean? I consult Wolfram Alpha:

Q: 9 W

A: About half the power expended by the human brain.

On a monthly basis?

Q: 9 W * (30 * 24 hours)

A: About half the energy released by combustion of one kilogram of gasoline.

In gallons?

Q: ( 1 kilogram / density of gasoline ) / 2

A: Less than a fifth of a gallon.

Relative to my electric usage, which was 1291 kWh last month?

Q: 9 W / (1291kwh / ( 30 * 24 hours)) * 100

A: Half a percent.

In dollars?

Q: 9 W / (1291kwh / ( 30 * 24 hours)) * $205.60

A: One dollar.

I find these comparisons really helpful. A dollar a month is a rounding error. But if I think of it as the energy equivalent of driving my car 7.2 miles, that makes me want to reach over and unplug the mixer for the 715 hours per month I’m not using it.

Saul Griffith has internalized these calculations, but most of us need help. A next-gen Kill-A-Watt that did these sorts of conversions and comparisons could be a real behavior changer.

Talking with Martin Hepp about solving the paradox of choice

In his luminous essay Information obesity, Ned Gulley illustrates the paradox of choice:

I’m reading about the Mohawk Trail, where the Cold River crashes noisily down the granitic glacier-fractured hillside. Where whispering understory birches are sheltered by towering firs. Now my mouth is watering. I have to go. I am referred to ReserveAmerica, a well-built web site that manages thousands of parks nationwide, and — DAMN! Mohawk Trail State Forest is booked solid. I start researching other nearby campgrounds, and now I’m sucked into the game. Unfortunately, ReserveAmerica lets you pick your campsite from an interactive map, and my book tells you which sites are the very best at each campground. Just when you start to salivate about the perfect spot, your dream is dashed by some early bird camper who’s beaten you to the reservation. You can cycle through this process for hours.

I borrow the phrase paradox of choice from Barry Schwartz, who argues in a compelling TED talk that as we broaden our options in all areas, we ratchet up our expectations about how good those options will be. The result is disappointment.

Less is more — except when it isn’t. My counterexample is a recent quest of mine for a particular kind of double-stick tape I needed for an interior storm window project. Key criteria included width (roughly 5/8″) and type of adhesion (plastic to wood). Web search yielded a bewildering array of choices, from various sources, but no way to filter by my criteria. This isn’t some idle consumer whim. I’m trying to save energy in the most effective way I can. I want to see as many qualifying choices as possible. But I can’t.

In Restructuring expert attention to revive the lost art of personal customer service I described one great solution to this problem: Kevin, the resident expert at FindTape.com, with whom I discussed SCF-01, DC-4420LB, and eventually settled on 3M-4905.

When there’s a Kevin available, he’ll be my first choice. But there won’t always be a Kevin. The answer in that case is not to artificially constrain my choices. That already happens because web search doesn’t enable me to state my criteria. Instead I want to search more effectively. To do that — as noted by several comments on Barry Schwartz’s TED video — we need to overcome filter failure.

This week’s Innovators show, with Martin Hepp, explores how we can create better filters. It’s a follow-on to an earlier show with Kingsley Idehen on the topics of RDFa, the GoodRelations ontology, and the idea that we can become the masters of our own search indexes.

The conversation mainly revolves around how to express an offer for goods or services by means of RDFa snippets that use the GoodRelations e-commerce vocabulary, that are generated by a form-based tool, and that rely on the web’s venerable traditions of view source and copy/paste.

But the same vocabulary used to describe offers can also express needs. And here Martin makes a really good observation about the current architecture of web search:

You can only search synchronously. You can’t ask a question and say, ‘Work on this for two weeks, improve your results in the background, and then come back with the best answer.’ But think about the potential if we can increase the amount of computational time for returning results. Currently there is only 400 milliseconds, because this is the average patience of web users. But if you can express what you’re looking for, and save it with a name, then the search engine will have two weeks to produce a good list of results.

I was also intrigued by Martin’s comments on intermediaries and affiliates. In his view, a commerce site like Amazon is not the only possible source of filter-enhancing metadata. Affiliates can play too. A travel service, for example, might supply search engines with enhanced views of Amazon relative to certain places and certain areas of expertise.

The paradox of choice is real, and in many cases we may indeed be happier with less. But when we really need or want more options, we shouldn’t have to prematurely foreclose them. Search could be far more effective, and an approach like the one Martin envisions is the way to make it so.

SQL Azure “Vidalia”: Practical translucency

Ever since Peter Wayner introduced me to the idea of a translucent database I’ve been thinking about the implications of this powerful idea. In a nutshell, the data in a translucent database service is opaque to the operator of the service, and visible only to sets of users who establish trust relationships. My 2002 review of Peter’s book summarizes his babysitter example:

Imagine a web service that enables parents to find available babysitters. A compromise would disastrously reveal vulnerable households where parents are absent and teenage girls are present. Translucency, in this case, means encrypting sensitive data (identities of parents, identities and schedules of babysitters) so that it is hidden even from the database itself, while yet enabling the two parties (parents, babysitters) to rendezvous.

Fast forwarding to 2009, here’s a current headline from InfoWorld: Microsoft adds access controls for SQL Azure online database. The article doesn’t say so, but this is database translucency in action.

The 2009 version of the babysitter example appears at 37:45 in this PDC session, where Dave Campbell and Rahul Auradkur discuss, and also show, a translucent pharmaceutical reagent marketplace. Dave Campbell spells out the scenario:

Pharma companies see reagents as being pre-competitive. They don’t compete at that level, and they’re willing to sell these reagents to one another, as long nobody can see what’s being bought and sold. That’s the controlled trust we need to set up.

The trick is accomplished by means of encryption and careful separation of concerns. Access policies are isolated from data storage, capable of federation, and auditable by trusted intermediaries.

This is exciting new territory. Historically, we’ve always assumed that the operator of an online information system has complete access to the data in that service. Translucency turns that assumption on its head, and leads to entirely new service design patterns. To implement those patterns requires more than just a database in the cloud. You also need a coordinated suite of supporting services for identity, access control, auditing, and more. Azure, as it becomes one provider of such services, will help make translucency a practical reality.

OData is grease to cut data friction

Back in 2007 I talked with Pablo Castro about Astoria, which I described as a way of making data readable and writeable by means of a RESTful interface. The technology has continued to move forward, and I’m now a heavy user of one of its implementations: the Azure table store. Yesterday at PDC we announced the proposed standardization of this approach as OData, which InfoQ nicely summarizes here.

I’ll leave detailed analysis of the proposal, and the inevitable comparisons to Google’s GData, to others who are better qualified. Nowadays I’m mainly a developer building a web service, and from that perspective it’s very clear that wide adoption of something like “ODBC for the cloud” is needed. We have no shortage of APIs, all of which yield XML and/or JSON data, but you have to overcome friction to compose with these APIs.

For example, the elmcity service merges event information from sets of iCalendar feeds and also from three different sources — Eventful, Upcoming, and (recently added) Eventbrite. In each of those three cases, I’ve had to create slightly different versions of the same algorithm:

  • Query for future events
  • Retrieve the count of matching events
  • Page through the matching events
  • Map events into a common data model

Each service uses a slightly different syntax to query for future events. And each reports the count of matching events differently: page_count vs. total_results vs. resultcount. OData would normalize the queries. And because the spec says:

The count value included in the result MUST be enclosed in an <m:count>

it would also normalize the counting of results.

Open data on the web has enormous potential value, but if we have to overcome too much data friction in order to combine it and make sense of it, we will often fail to realize that value. ODBC in its era was a terrific lubricant. I’m hoping that OData, widely implemented in software, services, and mashup environments like the just-announced Dallas, will be another.

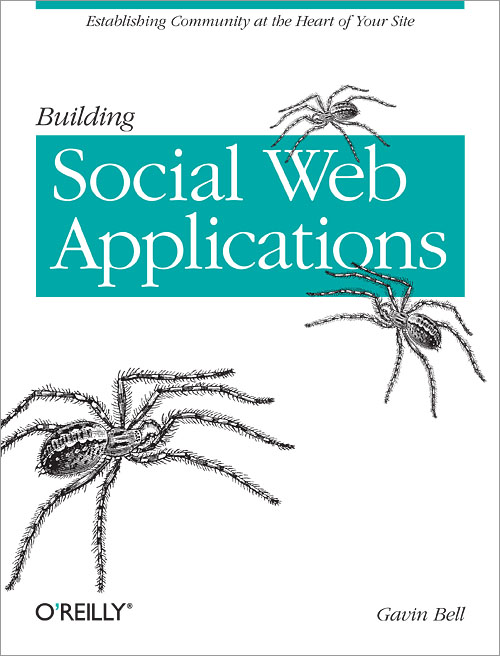
Talking with Gavin Bell about Building Social Web Applications

My guest for this week’s Innovators show is Gavin Bell, author of Building Social Web Applications. A lot has changed in the decade since I wrote my own book on this topic. One constant, as we discuss in the podcast, is that we still reach for special terminology like computer-supported collaborative work or groupware or social software. That won’t be true forever. Sooner or later we’ll take for granted that all networked information systems augment us collectively as well as individually. Until then, though, it remains appropriate to speak of social web applications as opposed to simply web applications.

Whatever we call this kind of software, it’s a challenge in this era of tech churn to write about it at book length. This effort succeeds by exploring patterns and principles that will endure no matter which technologies prevail. Yes, it’s an O’Reilly technical book, with the traditional animal picture on the cover — in this case, of spiders. But it’s not code-heavy. Gavin Bell aptly compares it to the polar bear book by Peter Morville and Louis Rosenfeld. Both books draw on a wealth of experience gleaned from building and evolving web applications.

For designers, developers, project managers, and online community managers, Building Social Web Applications addresses questions like:

What are the social objects at the core of our application?

How can relationships form around such objects?

Which search, navigation, access, and notification patterns can best support those relationships?

How do we evolve our application as our users gain experience with these object-mediated relationships?

We’ll be thinking about these kinds of questions from now on. Gavin Bell’s excellent book provides a framework in which to do that thinking.

Where is the money going?

Over the weekend I was poking around in the recipient-reported data at recovery.gov. I filtered the New Hampshire spreadsheet down to items for my town, Keene, and was a bit surprised to find no descriptions in many cases. Here’s the breakdown:

# of awards 25
# of awards with descriptions 05 20%
# of awards without descriptions 20 80%
$ of awards 10,940,770
$ of awards with descriptions 1,260,719 12%
$ of awards without descriptions 9,680,053 88%

In this case, the half-dozen largest awards aren’t described:

award amount funding agency recipient description
EE00161 2,601,788 Sothwestern Community Services Inc
S394A090030 1,471,540 Keene School District
AIP #3-33-SBGP-06-2009 1,298,500 City of Keene
2W-33000209-0 1,129,608 City of Keene
2F-96102301-0 666,379 City of Keene
2F-96102301-0 655,395 City of Keene
0901NHCOS2 600,930 Sothwestern Community Services Inc
2009RKWX0608 459,850 Department of Justice KEENE, CITY OF The COPS Hiring Recovery Program (CHRP) provides funding directly to law enforcement agencies to hire and/or rehire career law enforcement officers in an effort to create and preserve jobs, and to increase their community policing capacity and crime prevention efforts.
NH36S01050109 413,394 Department of Housing and Urban Development KEENE HOUSING AUTHORITY ARRA Capital Fund Grant. Replacement of roofing, siding, and repair of exterior storage sheds on 29 public housing units at a family complex

That got me wondering: Where does the money go? So I built a little app that explores ARRA awards for any city or town: http://elmcity.cloudapp.net/arra. For most places, it seems, the ratio of awards with descriptions to awards without isn’t quite so bad. In the case of Philadelphia, for example, “only” 27% of the dollars awarded ($280 million!) are not described.

But even when the description field is filled in, how much does that tell us about what’s actually being done with the money? We can’t expect to find that information in a spreadsheet at recovery.gov. The knowledge is held collectively by the many people who are involved in the projects funded by these awards.

If we want to materialize a view of that collective knowledge, the ARRA data provides a useful starting point. Every award is identified by an award number. These are, effectively, webscale identifiers — that is, more-or-less unique tags we could use to collate newspaper articles, blog entries, tweets, or any other online chatter about awards.

To promote this idea, the app reports award numbers as search strings. In Keene, for example, the school district got an award for $1.47 million. The award number is S394A090030. If you search for that you’ll find nothing but a link back to a recovery.gov page entitled Where is the Money Going?

Recovery.gov can’t bootstrap itself out of this circular trap. But if we use the tags that it has helpfully provided, we might be able to find out a lot more about where the money is going.

Talking with Marco Barulli about zero-knowledge online password management

A couple of years ago I was enamored with a clever password manager that pointed the way toward an ideal solution. It was really just a bookmarklet — a small chunk of JavaScript code — that used a simple method to produce a unique and strong password for the website you were visiting. The method was to combine a passphrase that you could remember with the domain name of the site, using a one-way cryptographic hash, in order to produce a strong password that would be unique to the site — and that you’d otherwise never be able to remember.

It wasn’t perfect. Sometimes the passwords it generated wouldn’t meet a site’s requirements. And sometimes the login domain name would vary, which broke the scheme. But it introduced me to two powerful — and related — ideas. JavaScript could turn your browser into a programmable cryptographic engine. And that engine could be used to implement protocols that relied on cryptography but transmitted no secrets over the wire.

To my way of thinking, that’s a killer combination. For years I’ve been using Bruce Schneier’s Password Safe, a Windows program that keeps my passwords in an encrypted store. There are many such programs, another example being 1Password for the Mac. This kind of app lives on your computer and talks to a local data store. That means it’s cumbersome to move the app and your data from one of your machines to another. And you can’t use it online, say from a public machine at the library or a friend’s computer.

Imagine a web application that would encrypt your credentials and store them in the cloud. It would deliver that encrypted store to any browser you happen to be using, along with a JavaScript engine that could decrypt it, display your credentials, and even use them to automatically log you onto any of your password-protected services. You’d trust it because its cryptographic code would be available for security pros to validate.

I’ve wanted this solution for a long time. Now I have it: Clipperz. My guest for this week’s Innovators show is Marco Barulli, founder and CEO of Clipperz, which he describes as a zero-knowledge web application. What Clipperz has zero knowledge of is you and your data. It just connects you with your data, on terms that you control, in a way that reminds me of Peter Wayner’s concept of translucent databases.

Clipperz is immediately useful to all of us who struggle to manage our growing collections of online credentials, But it’s also a great example of an important design principle. We reflexively build services that identity users and retain all kinds of information about them. Often we need such knowledge, but it’s a liability for the operators of services that store it, and a risk for users of those services. If it’s feasible not to know, we can embrace that constraint and achieve powerful effects.

A literary appreciation of the Olson/Zoneinfo/tz database

You will probably never need to know about the Olson database, also known as the Zoneinfo or tz database. And were it not for my elmcity project I never would have looked into it. I knew roughly that this bedrock database is a compendium of definitions of the world’s timezones, plus rules for daylight savings transitions (DST), used by many operating systems and programming languages.

I presumed that it was written Unix-style, in some kind of plain-text format, and that’s true. Here, for example, are top-level DST rules for the United States since 1918:

# Rule NAME FROM  TO    IN   ON         AT      SAVE    LETTER/S
Rule   US   1918  1919  Mar  lastSun    2:00    1:00    D
Rule   US   1918  1919  Oct  lastSun    2:00    0       S
Rule   US   1942  only  Feb  9          2:00    1:00    W # War
Rule   US   1945  only  Aug  14         23:00u  1:00    P # Peace
Rule   US   1945  only  Sep  30         2:00    0       S
Rule   US   1967  2006  Oct  lastSun    2:00    0       S
Rule   US   1967  1973  Apr  lastSun    2:00    1:00    D
Rule   US   1974  only  Jan  6          2:00    1:00    D
Rule   US   1975  only  Feb  23         2:00    1:00    D
Rule   US   1976  1986  Apr  lastSun    2:00    1:00    D
Rule   US   1987  2006  Apr  Sun>=1     2:00    1:00    D
Rule   US   2007  max   Mar  Sun>=8     2:00    1:00    D
Rule   US   2007  max   Nov  Sun>=1     2:00    0       S

What I didn’t appreciate, until I finally unzipped and untarred a copy of ftp://elsie.nci.nih.gov/pub/tzdata2009o.tar.gz, is the historical scholarship scribbled in the margins of this remarkable database, or document, or hybrid of the two.

You can see a glimpse of that scholarship in the above example. The most recent two rules define the latest (2007) change to US daylight savings. The spring forward rule says: “On the second Sunday in March, at 2AM, save one hour, and use D to change EST to EDT.” Likewise, on the fast-approaching first Sunday in November, spend one hour and go back to EST.

But look at the rules for Feb 9 1942 and Aug 14 1945. The letters are W and P instead of D and S. And the comments tell us that during that period there were timezones like Eastern War Time (EWT) and Eastern Peace Time (EPT). Arthur David Olson elaborates:

From Arthur David Olson (2000-09-25):

Last night I heard part of a rebroadcast of a 1945 Arch Oboler radio drama. In the introduction, Oboler spoke of “Eastern Peace Time.” An AltaVista search turned up :”When the time is announced over the radio now, it is ‘Eastern Peace Time’ instead of the old familiar ‘Eastern War Time.’ Peace is wonderful.”


Most of this Talmudic scholarship comes from founding contributor Arthur David Olson and editor Paul Eggert, both of whose Wikipedia pages, although referenced from the Zoneinfo page, strangely do not exist.

But the Olson/Eggert commentary is also interspersed with many contributions, like this one about the Mount Washington Observatory.

From Dave Cantor (2004-11-02)

Early this summer I had the occasion to visit the Mount Washington Observatory weather station atop (of course!) Mount Washington [, NH]…. One of the staff members said that the station was on Eastern Standard Time and didn’t change their clocks for Daylight Saving … so that their reports will always have times which are 5 hours behind UTC.


Since Mount Washington has a climate all its own, I guess it makes sense for it to have its own time as well.

Here’s a glimpse of Alaska’s timezone history:

From Paul Eggert (2001-05-30):

Howse writes that Alaska switched from the Julian to the Gregorian calendar, and from east-of-GMT to west-of-GMT days, when the US bought it from Russia. This was on 1867-10-18, a Friday; the previous day was 1867-10-06 Julian, also a Friday. Include only the time zone part of this transition, ignoring the switch from Julian to Gregorian, since we can’t represent the Julian calendar.

As far as we know, none of the exact locations mentioned below were permanently inhabited in 1867 by anyone using either calendar. (Yakutat was colonized by the Russians in 1799, but the settlement was destroyed in 1805 by a Yakutat-kon war party.) However, there were nearby inhabitants in some cases and for our purposes perhaps it’s best to simply use the official transition.


You have to have a sense of humor about this stuff, and Paul Eggert does:

From Paul Eggert (1999-03-31):

Shanks writes that Michigan started using standard time on 1885-09-18, but Howse writes (pp 124-125, referring to Popular Astronomy, 1901-01) that Detroit kept

local time until 1900 when the City Council decreed that clocks should be put back twenty-eight minutes to Central Standard Time. Half the city obeyed, half refused. After considerable debate, the decision was rescinded and the city reverted to Sun time. A derisive offer to erect a sundial in front of the city hall was referred to the Committee on Sewers. Then, in 1905, Central time was adopted by city vote.


This story is too entertaining to be false, so go with Howse over Shanks.


The document is chock full of these sorts of you-can’t-make-this-stuff-up tales:

From Paul Eggert (2001-03-06), following a tip by Markus Kuhn:

Pam Belluck reported in the New York Times (2001-01-31) that the Indiana Legislature is considering a bill to adopt DST statewide. Her article mentioned Vevay, whose post office observes a different
time zone from Danner’s Hardware across the street.


I love this one about the cranky Portuguese prime minister:

Martin Bruckmann (1996-02-29) reports via Peter Ilieve

that Portugal is reverting to 0:00 by not moving its clocks this spring.
The new Prime Minister was fed up with getting up in the dark in the winter.


Of course Gaza could hardly fail to exhibit weirdness:

From Ephraim Silverberg (1997-03-04, 1998-03-16, 1998-12-28, 2000-01-17 and 2000-07-25):

According to the Office of the Secretary General of the Ministry of Interior, there is NO set rule for Daylight-Savings/Standard time changes. One thing is entrenched in law, however: that there must be at least 150 days of daylight savings time annually.


The rule names for this zone are poignant too:

# Zone  NAME            GMTOFF  RULES   FORMAT  [UNTIL]
Zone    Asia/Gaza       2:17:52 -       LMT     1900 Oct
                        2:00    Zion    EET     1948 May 15
                        2:00 EgyptAsia  EE%sT   1967 Jun  5
                        2:00    Zion    I%sT    1996
                        2:00    Jordan  EE%sT   1999
                        2:00 Palestine  EE%sT

There’s also some wonderful commentary in the various software libraries that embody the Olson database. Here’s Stuart Bishop on why pytz, the Python implementation, supports almost all of the Olson timezones:

As Saudi Arabia gave up trying to cope with their timezone definition, I see no reason to complicate my code further to cope with them. (I understand the intention was to set sunset to 0:00 local time, the start of the Islamic day. In the best case caused the DST offset to change daily and worst case caused the DST offset to change each instant depending on how you interpreted the ruling.)


It’s all deliciously absurd. And according to Paul Eggert, Ben Franklin is having the last laugh:

From Paul Eggert (2001-03-06):

Daylight Saving Time was first suggested as a joke by Benjamin Franklin in his whimsical essay “An Economical Project for Diminishing the Cost of Light” published in the Journal de Paris (1784-04-26). Not everyone is happy with the results.


So is Olson/Zoneinfo/tz a database or a document? Clearly both. And its synthesis of the two modes is, I would argue, a nice example of literate programming.

More Python and C# idioms: Finding the difference between two lists

Recently I’ve posted two examples[1, 2] of Python idioms alongside corresponding C# idioms. It always intrigues me to look at the same concept through different lenses, and it seems to intrigue others as well, so here’s a third installment.

Today’s example comes from a real scenario. I’ve recently added a feature to the elmcity service that enables curators to control their hubs by sending Twitter direct messages to the service. One method, GetDirectMessagesFromTwitter, calls the Twitter API and returns a list of direct messages sent to the elmcity service. Another method, GetDirectMessagesFromAzure, calls the Azure table storage API and returns a list of direct messages stored there. The difference between the two lists — if any — represents new messages to be processed.

Here’s one take on Python and C# idioms for finding the difference between two lists:

Python C#
fetched_messages = 
  GetDirectMessagesFromTwitter();
stored_messages = 
  GetDirectMessagesFromAzure();
diff = set(fetched_messages) - 
  set(stored_messages)
return list(diff)
var fetched_messages = 
  GetDirectMessagesFromTwitter();
var stored_messages = 
  GetDirectMessagesFromAzure();
var diff = fetched_messages.Except(
  stored_messages);
return diff.ToList();

I can’t decide which one I prefer. Python’s set arithmetic is mathematically pure. But C#’s noun-verb syntax is appealing too. Which do you prefer? And why?


PS: The Python example above is slightly concocted. It won’t work as shown here because I’m modeling Twitter direct messages as .NET objects. IronPython can use those objects, but the set subtraction fails because the objects returned from the two API calls aren’t directly comparable.

A real working example would add something like this:

fetched_message_sigs = [x.text+x.datetime for x in fetched_messages]
stored_message_sigs = [x.text+x.datetime for x in stored_messages]
diff = list(set(fetched_message_sigs) - set(stored_message_sigs))

But that’s a detail that would only obscure the side-by-side comparison I’m making here.

To: elmcity, From: @curator, Message: start

Because I am lazy, curious, and evangelical, the elmcity service works in an unusual way. Anything that I can delegate to other services I do. So when curators add feeds to hubs, or modify the behavior of hubs, they do it by bookmarking and tagging URLs at delicious.com. It would be foolish to only keep that registry and configuration data in delicious, so I don’t, I persist it to Azure tables. But for now, I’m delegating the data entry interface to delicious.

It’s a lazy approach, in the good sense of lazy. I don’t want to build my own data entry system unless I can add important value, and in this case I can’t.

I’m also curious to see how far this approach can take us. As the project has evolved, so has the tag vocabulary spoken between curators and the service. It’s an easy and natural process, and I don’t see any roadblocks ahead.

Finally, I’m evangelizing this way of doing things because I continue to think that more people should appreciate it.

In this scenario I’ve delegated something else to delicious: authentication. My service doesn’t have its own user accounts. Instead, as the administrator of the service, I tell it to trust a specific set of delicious accounts. When one of those accounts bookmarks an iCalendar URL, and tags it in a particular way, the service regards that as an authenticated request to add the feed to that hub’s registry.

Other requests that curators can make include:

Make the radius for my hub 5 miles.

Make my timezone Arizona.

Get my CSS file from this URL.

But here’s one that curators have wanted to make and couldn’t:

I just added a feed or changed a configuration option. Please reprocess my hub ASAP.

We could represent this message with a tag. Or we could use the rudimentary messaging system in delicious. But these approaches seemed awkward, and I rejected them.

Well, why not Twitter? True, it means that curators who want to send messages to the service will now need accounts in two places. But if they don’t already have accounts on both delicious and Twitter, they can create them. And those accounts will serve them in a variety of ways, unlike a single-purpose account on elmcity.

So, it’s done. As the curator for Keene, I’ve added the tag twitter=judell to the delicious account that controls the Keene hub. As the elmcity service periodically scans its designated set of delicious accounts, it follows any Twitter handle it isn’t already following. Those Twitter accounts can then send direct messages to the Twitter account of the elmcity service.

For now there’s only one thing a curator can say to the service in a direct message — “start” — which means “please reprocess my hub ASAP.” But I’m sure the control vocabulary will evolve. And of course the service can use the channel to send notifications back to curators.

Twitter is famously unreliable, but that should be OK for my purposes. We’re not controlling the space shuttle. If a message doesn’t get through to the service on the first or second try, it’ll get through eventually, and that’ll be good enough.

Someday I may have to build a data entry system and an accounts system. Then again, maybe not. Meanwhile I’m going to keep exploring this lightweight approach. It’s effective and, not coincidentally, it’s fun.

Restructuring expert attention to revive the lost art of personal customer service

Instead of mourning the lost art of personal customer service, I would rather celebrate examples that show it’s still possible. Yesterday I found two gems.

First, Southwest Airlines. I had booked a round-trip flight and then needed to change to one-way. You can’t do that online. So I clenched my jaw, called customer service, and prepared for the long wait.

Instead, this:

IVR: “Would you like us to call you back in about 20 minutes?”

Me: “Why…yes! Beep, beep, beep, beep, beep, beep, beep, #.”

My jaw relaxed.

Twenty or so minutes later, an agent called back and we made the change. Now the unclenched jaw morphed into a smile.

Second, FindTape.com. I’m making interior storm windows and I need double-stick tape for the project. Which, sure, you can buy online. But the smorgasbord of choices is paralyzing. I wasted a half-hour trying to figure out which product would best suit my unusual application and made no progress whatsoever.

Then, at FindTape.com, I read this:

If you have a specific question related to which tape would work best in your application please fill out and submit the following fields so that we can have an appropriate representative get back in contact with you.

A fellow named Kevin wrote back, we’ve have been discussing my options, and now I’m ready to buy.

Both examples remind me of Michael Nielsen’s luminous phrase: the restructuring of expert attention. He coined it to define a new era of scientific collaboration, but it applies more broadly.

We’ve been told that companies can’t afford to focus expert attention on customers. The truth, of course, is that they can’t afford not to.

For a generation and more we’ve driven a wedge between people who have expertise with products and services and people who need that expertise. How’s that working for you? Me neither.

It’s true that expert attention is a scarce resource. But we’re living through a Cambrian explosion of awareness networks and communication modes. Used adroitly, they can optimize the allocation of that scarce resource. Which is a fancy way of saying: Maybe personal customer service isn’t a lost art after all.

Allman Brothers, Oct 14: Huntington or Nashville? A parable about syndication and provenance.

Yesterday Bill Rawlinson, the elmcity curator for Huntington, WV, noticed something odd about an event that showed up on Eventful.com:

Here’s the example: http://eventful.com/huntington/events/allman-brothers-/E0-001-020736056-0. It appears the Allman Brothers were in concert today, but I’m pretty sure they weren’t.

I’m pretty sure they weren’t either. At AllmanBrothersBand.com it says they were in Nashville on October 14. But if that’s true, Eventful isn’t the only site that got it wrong date. So, apparently, did a number of event-gathering and ticket-selling sites. Here are couple of examples I found.

In cases like these it’s hard to nail down the provenance of a “fact” such as Allman Brothers, Huntington WV, October 14 2009. There is clearly syndication going on, but who’s upstream and who’s downstream? How is the network of feeds interconnected? Which is the authoritative source?

I know what the answer to all these questions should be. The Allman Brothers themselves should be the authoritative source, and everyone else should syndicate from them.

If AllmanBrothersBand.com published its schedule as calendar data rather than as calendarish web pages, the organization could control the data. Was there originally a concert planned for Huntington on the 14th? I don’t know, but say for the sake of argument there was. The Allman Brothers calendarish web page cannot effectively propagate a change of plan.

An iCalendar feed, on the other hand, could. But calendarish web page are almost never alternately available as machine-readable iCalendar data that can reliably syndicate.

Looking under the covers, I see that AllmanBrothersBand.com is a PostNuke site. Are there calendar modules for PostNuke that export iCalendar? None of the ones that I found seem to.

Why don’t more content management systems make event information available as useful data? Why do they instead advertise things like XHTML compliance and not-very-useful RSS feeds? Because, chicken-and-egg, nobody ever seems to expect an iCalendar feed.

If we can change that expectation, a nice chunk of the real-world semantic web will fall into place. And it won’t require RDFa or SPARQL or ontologies. Just good old RFC2445, right under our noses the whole time, if only we would open our eyes and look.

Talking with Daniel Debow about using Rypple to open the Johari Window

On this week’s Innovators show, with Daniel Debow of Rypple, I learned about a cognitive psychological tool called the Johari Window. Rypple focuses on the quadrant of the Johari Window at the intersection of “known to others” and “not known to self” — the so-called blind area. The company is dedicated to the proposition that if we can become more aware of what others know about us that we don’t, we can improve ourselves along various axes: personal, social, and — critically for Rypple’s business model — professionally.

How do you gain that awareness? By asking questions like:

Am I giving sufficiently clear guidance?

or

Do I interrupt people too often?

You direct these questions to a set of people whose feedback you value. Rypple anonymizes their responses and, to the extent you buy into the service, provides a progressively capable framework within which to continue the dialogue. This is a great idea, and one of the very few appropriate uses for online anonymity that I can imagine.

Rypple, as a company, lives at the intersection of a couple of key trends. Social media, obviously, but also the services ecosystem. As we discuss in the podcast, corporate HR has historically been a monolith that expects 100% compliance with its systems. But people, as we know, differ emotionally and cognitively. We should be able to use a variety of methods to manage and evaluate people, and help them manage and evaluate themselves. Software delivered as a service is an enabler of that possibility.

Here’s a twist: A company won’t have access to the feedback that employees solicit using Rypple. Daniel Debow says that HR folks, well aware of mainstream social software, are ready to embrace this model. I hope he’s right.

His favorite recent story about Rypple goes like this:

At an HR conference I talked to the CEO of a company that uses Rypple. He’s excited about what we’re doing, but he said: “You have a real problem. Use of your system might make your system obselete. We’ve been using it for a while now, and I’ve noticed that people are much more willing to give me feedback face-to-face, they’re willing to talk to me.”

Well that’s the furthest thing from a problem I can imagine. It’s like saying to Facebook, you’ve got a problem, people keep meeting on Facebook and then meeting up in person and creating real relationships offline.

Actually that would be problem for Facebook. But Rypple isn’t about pageviews, it’s about helping people improve. Which seems like a great idea to me.

You can, by the way, use Rypple not only to solicit anonymized feedback from a chosen set of responders, but also from an open-ended set. So here’s my question:

How can I make my ideas more accessible and more actionable?

I’m asking a chosen set too, but if you can perceive my blind spot I’d love to know what you see there.

More visualization of Nobel Peace Prize winners in Freebase

To sharpen the point I made the other day about the eroding bias toward giving the Nobel Peace Prize to Americans and Europeans, here’s a comparison of the nationalities of winners before and after 1960.

1901-2009 nobel peace prize winners by nationality
before 1960 after 1960

Here’s another point I forgot to mention. There are gaps in timeline for the Nobel Peace Prize, because it wasn’t awarded in 1914-1918, 1923, 1924, 1928, 1932, 1939-1943, 1948, 1955-1956, 1966-1967 and 1972. The timeline shows those gaps concisely:

As in the earlier examples, you can do this with point-and-click filtering in Freebase, no query-writing required. Which is awesome.

Finally, Stefano Mazzocchi offers a clarification of a point that came up in our recent interview:

I made it sound like Freebase loaded directly IMDB data while what I should have specified is that we loaded the IMDB ‘identifiers’ along with our movie data.

Thanks Stefano. And, kudos to the Metaweb team!

Recovering forgotten methods of construction

After feasting on audio podcasts for years, I realized that I don’t always want somebody else’s voice in my head while running, biking, and hiking. So I went on an audio fast for a couple of months. But now I’m ready for more input, and I’m once again reminded how wonderful it is to be able to bring engaging minds with me on my outdoor excursions.

One of my companions on yesterday’s hike was John Ochsendorf, a historian and structural engineer who explores the relevance of ancient and sometimes forgotten construction methods, like Incan suspension bridges woven from grass. One of his passions is Guastavino tile vaulting, a system that was patented in 1885. Although widely used in many notable structures — including Grand Central Station — Ochsendorf says that some of these structures have been torn down and rebuilt conventionally because modern engineers no longer understand how the Guastavino system works, and cannot evaluate its integrity.

This theme of forgotten knowledge echoes something I heard in Amory Lovins’ epic MAP/Ming lecture series. He describes a large government building in Washington, DC, that was made of stone and cooled by a carefully-designed pattern of air flow. The cooling system wasn’t completely passive, though. You had to open and close windows in a particular sequence throughout the day. Now that building is cooled by hundreds of window-mounted air conditioners. I’m sure our modernn expectation of extreme cooling is part of the reason why. But Lovins also says that air conditioning became necessary because people forgot how to operate the building.

I love the idea of recovering — and scientifically validating — forgotten knowledge. That’s what John Ochsendorf’s research group does. One of his students, Joe Dahmen, did a project called Rammed Earth — a long-term experiment to see if that ancient construction method could actually work in present-day New England. John Ochsendorf says:

Historical methods of construction that are very green, very local, may create beautiful low-energy architecture, we’ve forgotten how to do them. So we have to rediscover them, and do testing to prove to clients and building owners that you can use these methods. And it’s a good example of MIT’s motto of mind and hand. We don’t like to just read about rammed earth walls, we like to get dirty and build them.

Very cool. I think the MacArthur Foundation invested wisely in this guy.

Visualizing Nobel Peace Prize winners in Freebase

When I watched Barack Obama accept the Nobel Peace Prize, I thought about how the world has changed since the inception of the prize, and how it will continue to change. Since the winners of the Prize are themselves a reflection of what’s changing, I thought I’d try using Freebase to visualize them over the century the Prize has existed.

What you can find out, with Freebase, depends on its coverage of the topics you’re asking about. So realize that what I’ll show here is possible because Nobel Peace Prize winners are a well-covered topic. Still, it’s wildly impressive.

The Nobel site tells us that 89 Nobel Peace Prizes have been awarded since 1901. I haven’t been able to reproduce that number in Freebase because there are multiple winners in a few years, and I haven’t found a way to group results by year. But for my purposes this related query is good enough:

That number, 100, isn’t as closely related to 89 as you might think. It’s less by the number of years no award was given, but more by the number of recipients in multiple-award years. Perhaps a Freebase guru can show us how to measure those uncertainties, but I’ve eyeballed them and I don’t think they invalidate my results.

How did I wind up querying the topic /award/award_winner? It wasn’t immediately obvious. I spent a while searching and then exploring the facets that emerged, including:

The crazy thing about Freebase is that, in a way, it doesn’t matter where you start. Everything’s connected to everything, so you can pick up any node of the graph and re-dangle the rest.

Except when you can’t. I haven’t yet gotten a good feel for which paths to prefer and why.

But in the end I came up with the kind of results I’d envisioned:

1901-2009 nobel peace prize winners by gender
male female

1901-2009 nobel peace prize winners by nationality
male female

Taken together they show a couple of trends. First, of course, we see most female winners after about 1960. Second, we see a more even geographic distribution of female winners because, prior to 1960, most winners were not only male but also American or European.

These results didn’t surprise me. What did is the relative ease with which I was able to discover and document them. I thought it would be necessary to write MQL queries in order to do this kind of analysis. I’d previously done a bit of work with MQL, and dug further into it this time around.

But in the end I found that it was just as effective to use interactive filtering. Now to be clear, getting the software to actually do the things I’ve shown here wasn’t a cakewalk. I had to develop a feel for the web of topics in the domain I chose. And it’s painfully slow to add and drop filters.

But still, it’s doable. And you can do it yourself by pointing and clicking. That is an astonishing tour de force, and a glimpse of what things will be like when we can all fluently visualize information about our world.

Magic glasses and magic projectors: Private versus public augmentation of experience

At its core, your browser is powered by an engine called the Document Object Model, hereafter DOM. You can think of the DOM as an outline, and the browser as an outline processor that shows and hides things, displays things in different ways, and even adds, removes, or rearranges things. Nowadays what you see, when you view a web page, is the result of a complex interaction between data and code. The data is the HTML content of the page, and the code is its JavaScript behavior. But these are slippery terms. A lot of content never originates as HTML, but is instead produced dynamically — by a web server, but also quite possibly in the browser as it manipulates the DOM. And a lot of behavior happens opportunistically in response to content on the page.

This arrangement has radical implications. For example, back in 2002 I invented LibraryLookup, a bookmarklet that noticed when you were visiting an Amazon or Barnes and Noble book page and offered a one-click search for that book in your local library. A few years later, a Firefox extension called Greasemonkey arrived on the scene. It offered two capabilities that, working together, enabled a zero-click LibraryLookup. First, it could call out to a web service. Second, it could modify the DOM based on the response. Putting these two things together, I wrote a script that would notice that you were visiting an Amazon book page, check to see if the book was available at your local library, and if so, insert a paragraph into the DOM that said: “Hey, it’s available at the [YOUR LIBRARY NAME] library!”

Is this kosher? I think so, but it’s a tricky question. At the time I made a short screencast that reflected on questions of ownership and fair use in an environment that’s designed and built to support intermediation and remixing. These questions were still largely hypothetical, though, because Firefox users who had also installed Greasemonkey were a very small number indeed.

But now, thanks to modern browser-independent JavaScript libraries like jQuery, those hypothetical questions are becoming very real. Here’s Phil Windley demonstrating his 2009 version of LibraryLookup:

The example comes from Phil’s recent essay The Forgotten Edge: Building a Purpose-Centric Web, which makes the case for contextualized browsing as enabled by libraries like jQuery and by infrastructure like that provided by Phil’s company, Kynetx.

In Phil’s next blog item, Claiming My Right to a Purpose-Centric Web: SideWiki, he asserts:

I claim the right to mash-up, remix, annotate, augment, and otherwise modify Web content for my purposes in my browser using any tool I choose and I extend to everyone else that same privilege.

That item grew a long tail of comments. It includes some interesting back-and-forth between Phil Windley and Dave Winer, but I want to focus on this observation from Greg Yardley:

Sites also generally come with a contract attached – some implicit (the view-through), some explicit (the click-through) – and these contracts, done correctly, are generally enforceable.

This whole post mystifies me, because you don’t have the the right to mash-up, remix, annotate, augment, and otherwise modify Web content – it’s not your content.

Earlier in the thread, Jeremy Pickens cited an example of such a contract: Google’s terms of service:

8.2 You should be aware that Content presented to you as part of the Services, including but not limited to advertisements in the Services and sponsored Content within the Services may be protected by intellectual property rights which are owned by the sponsors or advertisers who provide that Content to Google (or by other persons or companies on their behalf). You may not modify, rent, lease, loan, sell, distribute or create derivative works based on this Content (either in whole or in part) unless you have been specifically told that you may do so by Google or by the owners of that Content, in a separate agreement.

In response to Greg Yardley, Phil Rees cites fair use:

Actually we do have those rights.

http://www.law.cornell.edu/uscode/17/107.html

I believe so too. Sooner or later, that belief will be tested.

After my March interview with Phil about Kynetx, I wrote:

There’s a continuum of ways in which I can modify a web page in a browser, ranging from font enlargement to translation to contexual overlays. I wouldn’t draw a line anywhere along that continuum. It seems to me that I’m entitled to view the world through any lens I choose.

This doesn’t only apply to my view of the virtual world, by the way. It will apply to my view of the physical world too. We don’t yet have magic glasses that overlay web prices on shelf items, or web reputations on store signage, but someday we will.

I can’t see how I could be prevented from creating a heads-up display — for realspace or cyberspace — that’s advantageous to me. But I’ve got a hunch that those magic glasses are going to be controversial.

I wonder if it’s going to boil down to magic glasses versus magic projectors. Or, in other words, private versus public augmentation of our experiences of the virtual and real worlds. I can wear my magic glasses, but I can’t necessarily project the view that I’m seeing.

Talking with Victoria Stodden about Science Commons

On this week’s Innovators show I spoke with Victoria Stodden about Science Commons, an effort to bring the values and methods of Creative Commons to the realm of science. Because modern science is so data- and computation-intensive, Science Commons provides legal tools that govern the sharing of data and code. There are lots of good reasons to share the artifacts of scientific computation. Victoria particularly focuses on the benefit of reproducibility. It’s one thing to say that your analysis of a data set leads to a conclusion. It’s quite another to give me your data, and the code you used to process it, and invite me to repeat the experiment.

In this kind of discussion, the word “repository” always comes up. If you put your stuff into a repository, I can take it out and work with it. But I’ve always had a bit of an allergic reaction to that word, and during this podcast I realized why: it connotes a burial ground. What goes into a repository just sits there. It might be looked at, it might be copied, but it’s essentially inert, a dead artifact divorced from its live context.

Sooner or later, cloud computing will change that. The live context in which primary research happens will be a shareable online space. Publishing won’t entail pushing your code and data to a repository, but rather granting access to that space.

It’s a hard conceptual shift to make, though. We think of publishing as a way of pushing stuff out from where we work on it to someplace else where people can get at it. But when we do our work in the cloud, publishing is really just an invitation to visit us there.

Querying mobile data objects with LINQ

I’m using US census data to look up the estimated populations of the cities and towns running elmcity hubs. The dataset is just plain old CSV (comma-separated variable), a format that’s more popular than ever thanks in part to a new wave of web-based data services like DabbleDB, ManyEyes, and others.

For my purposes, simple pattern matching was enough to look up the population of a city and state. But I’d been meaning to try out LINQtoCSV, the .NET equivalent of my old friend, Python’s csv module. As happens lately, I was struck by the convergence of the languages. Here’s a side-by-side comparison of Python and C# using their respective CSV modules to query for the population of Keene, NH:

Python C#
 
 
i_name = 5
i_statename = 6
 
i_pop2008 = 17
 
 
handle = urllib.urlopen(url)


reader = csv.reader(
  handle, delimiter=',')
 
 
rows = itertools.ifilter(lambda x : 
  x[i_name].startswith('Keene') and 
  x[i_statename] == 'New Hampshire', 
    reader)
 
found_rows = list(rows)


count = len(found_rows)
 
if ( count > 0 ):
  pop = int(found_rows[0][i_pop2008])    
public class USCensusPopulationData
  {   
  public string NAME;
  public string STATENAME;
  ... etc. ...
  public string POP_2008;
  }
  
var csv = new WebClient().
  DownloadString(url);
  
var stream = new MemoryStream(
  Encoding.UTF8.GetBytes(csv));
var sr = new StreamReader(stream);
var cc = new CsvContext();
var fd = new CsvFileDescription { };
  
var reader = 
  cc.Read<USCensusPopulationData>(sr, fd);
  
 
var rows = reader.ToList();


var found_rows = rows.FindAll(row => 
  row.name.StartsWith('Keene') && 
  row.statename == 'New Hampshire');
  
var count = rows.Count;
  
if ( count > 0 )
  pop = Convert.ToInt32(
    found_rows[0].pop_2008)

Things don’t line up quite as neatly as in my earlier example, or as in the A/B comparison (from way back in 2005) between my first LINQ example and Sam Ruby’s Ruby equivalent. But the two examples share a common approach based on iterators and filters.

This idea of running queries over simple text files is something I first ran into long ago in the form of the ODBC Text driver, which provides SQL queries over comma-separated data. I’ve always loved this style of data access, and it remains incredibly handy. Yes, some data sets are huge. But the 80,000 rows of that census file add up to only 8MB. The file isn’t growing quickly, and it can tell a lot of stories. Here’s one:

2000 - 2008 population loss in NH

-8.09% Berlin city
-3.67% Coos County
-1.85% Portsmouth city
-1.85% Plaistow town
-1.78% Balance of Coos County
-1.43% Claremont city
-1.02% Lancaster town
-0.99% Rye town
-0.81% Keene city
-0.23% Nashua city

In both Python and C# you can work directly with the iterators returned by the CSV modules to accomplish this kind of query. Here’s a Python version:

import urllib, itertools, csv

i_name = 5
i_statename = 6
i_pop2000 = 9
i_pop2008 = 17

def make_reader():
  handle = open('pop.csv')
  return csv.reader(handle, delimiter=',')

def unique(rows):
  dict = {}
  for row in rows:
    key = "%s %s %s %s" % (i_name, i_statename, 
      row[i_pop2000], row[i_pop2008])    
    dict[key] = row
  list = []
  for key in dict:
    list.append( dict[key] )
  return list

def percent(row,a,b):
  pct = - (  float(row[a]) / float(row[b]) * 100 - 100 )
  return pct

def change(x,state,minpop=1):
  statename = x[i_statename]
  p2000 = int(x[i_pop2000])
  p2008 = int(x[i_pop2008])
  return (  statename==state and 
            p2008 > minpop   and 
            p2008 < p2000 )

state = 'New Hampshire'

reader = make_reader()
reader.next() # skip fieldnames

rows = itertools.ifilter(lambda x : 
  change(x,state,minpop=3000), reader)

l = list(rows)
l = unique(l)
l.sort(lambda x,y: cmp(percent(x,i_pop2000,i_pop2008),
  percent(y,i_pop2000,i_pop2008)))

for row in l:
  print "%2.2f%% %s" % ( 
       percent(row,i_pop2000,i_pop2008),
       row[i_name] )

A literal C# translation could do all the same things in the same ways: Convert the iterator into a list, use a dictionary to remove duplication, filter the list with a lambda function, sort the list with another lambda function.

As queries grow more complex, though, you tend to want a more declarative style. To do that in Python, you’d likely import the CSV file into a SQL database — perhaps SQLite in order to stay true to the lightweight nature of this example. Then you’d ship queries to the database in the form of SQL statements. But you’re crossing a chasm when you do that. The database’s type system isn’t the same as Python’s. And database’s internal language for writing functions won’t be Python either. In the case of SQLite, there won’t even be an internal language.

With LINQ there’s no chasm to cross. Here’s the LINQ code that produces the same result:

var census_rows = make_reader();

var distinct_rows = census_rows.Distinct(new CensusRowComparer());

var threshold = 3000;

var rows = 
  from row in distinct_rows
  where row.STATENAME == statename
      && Convert.ToInt32(row.POP_2008) > threshold
      && Convert.ToInt32(row.POP_2008) < Convert.ToInt32(row.POP_2000) 
  orderby percent(row.POP_2000,row.POP_2008) 
  select new
    {
    name = row.NAME,
    pop2000 = row.POP_2000,
    pop2008 = row.POP_2008    
    };

 foreach (var row in rows)
   Console.WriteLine("{0:0.00}% {1}",
     percent(row.pop2000,row.pop2008), row.name );

You can see the supporting pieces below. There are a number of aspects to this approach that I’m enjoying. It’s useful, for example, that every row of data becomes an object whose properties are available to the editor and the debugger. But what really delights me is the way that the query context and the results context share the same environment, just as in the Python example above. In this (slightly contrived) example I’m using the percent function in both contexts.

With LINQ to CSV I’m now using four flavors of LINQ in my project. Two are built into the .NET Framework: LINQ to XML, and LINQ to native .NET objects. And two are extensions: LINQ to CSV, and LINQ to JSON. In all four cases, I’m querying some kind of mobile data object: an RSS feed, a binary .NET object retrieved from the Azure blob store, a JSON response, and now a CSV file.

Six years ago I was part of a delegation from InfoWorld that visited Microsoft for a preview of technologies in the pipeline. At a dinner I sat with Anders Hejslberg and listened to him lay out his vision for what would become LINQ. There were two key goals. First, a single environment for query and results. Second, a common approach to many flavors of data.

I think he nailed both pretty well. And it’s timely because the cloud isn’t just an ecosystem of services, it’s also an ecosystem of mobile data objects that come in a variety of flavors.


private static float percent(string a, string b)
  {
  var y0 = float.Parse(a);
  var y1 = float.Parse(b);
  return - ( y0 / y1 * 100 - 100);
  }

private static IEnumerable<USCensusPopulationData> make_reader()
  {
  var h = new FileStream("pop.csv", FileMode.Open);
  var bytes = new byte[h.Length];
  h.Read(bytes, 0, (Int32)h.Length);
  bytes = Encoding.UTF8.GetBytes(Encoding.UTF8.GetString(bytes));
  var stream = new MemoryStream(bytes);
  var sr = new StreamReader(stream);
  var cc = new CsvContext();
  var fd = new CsvFileDescription { };

  var census_rows = cc.Read<USCensusPopulationData>(sr, fd);
  return census_rows;
  }

public class USCensusPopulationData
  {
  public string SUMLEV;
  public string state;
  public string county;
  public string PLACE;
  public string cousub;
  public string NAME;
  public string STATENAME;
  public string POPCENSUS_2000;
  public string POPBASE_2000;
  public string POP_2000;
  public string POP_2001;
  public string POP_2002;
  public string POP_2003;
  public string POP_2004;
  public string POP_2005;
  public string POP_2006;
  public string POP_2007;
  public string POP_2008;

  public override string ToString()
    {
    return
      NAME + ", " + STATENAME + " " + 
      "pop2000=" + POP_2000 + " | " +
      "pop2008=" + POP_2008;
    } 
  }

public class  CensusRowComparer : IEqualityComparer<USCensusPopulationData>
  {
  public bool Equals(USCensusPopulationData x, USCensusPopulationData y)
    {
    return x.NAME == y.NAME && x.STATENAME == y.STATENAME ;
    }

  public int GetHashCode(USCensusPopulationData obj)
    {
    var hash = obj.ToString();
    return hash.GetHashCode();
    }
  }
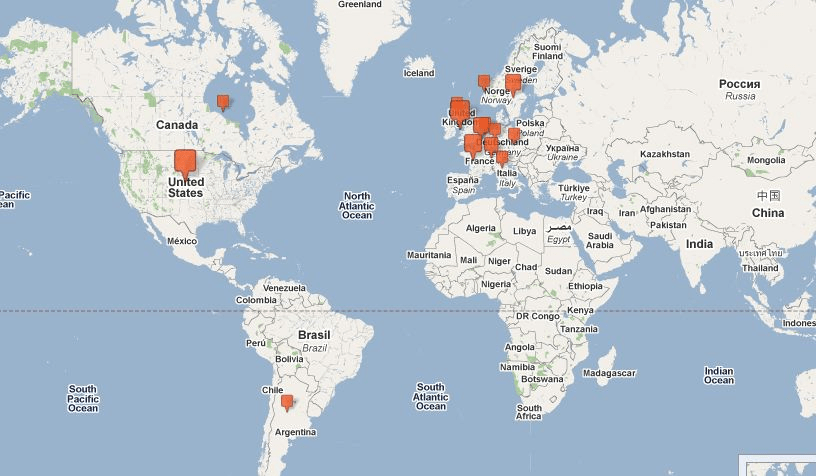
Talking with Stefano Mazzocchi about reconciling web naming systems

When Stefano Mazzocchi saw my posts on webscale identiers[1, 2] he pointed me to some recent work he and others have been doing at Metaweb. At ids.freebaseapps.com you can find sets of different web identifiers that refer to the same things. So, for example:

Apple Inc.
versus
Apple Records

Each of these views collects identifiers from different sources. For Apple Inc. they include:

The NYTimes: topics.nytimes.com/top/news/business/companies/apple_computer_inc/

Wikipedia: wikipedia.org/wiki/Apple_Computer

Open Library: openlibrary.org/a/OL2669993A/Inc._Apple_Computer

On this week’s Innovators show Stefano joins me to discuss efforts underway at Metaweb to reconcile many different web naming systems and activate connections among them.

Meanwhile my recent guest Kingsley Idehen is demonstrating a similar kind of name reconciliation at bbc.openlinksw.com. At this URL, for example, you can see canonical identifers for Michael Jackson from the BBC’s own namespace and others including DBpedia and OpenCyc.

I’m not quite sure what to make of all this. But my spidey sense is telling me to pay attention, so I am.


Related:

  1. Semantic web mashups for the rest of us

  2. A conversation with Stefano Mazzocchi about Cocoon and SIMILE

  3. Motivating people to write the semantic web: A conversation with David Huynh about Parallax

  4. Talking with Kingsley Idehen about mastering your own search index

Speaking and writing webscale identifiers

I’ve really enjoyed the conversation about webscale identifiers. Naming web resources is such a crucial discipline, and yet one we’re all still making up as we go along. I ended the earlier post by suggesting that when we invent namespaces we should, where feasible, prefer names that make sense to people. In comments, a number of folks who have wrestled with the problem of ambiguity pointed out all sorts of reasons why that often just isn’t feasible.

Gavin Bell likes Amazon’s hybrid approach:

The model that Amazon have since moved to with a unique URL identifier and an ignored pretty human readable section is a good compromise.

Michael Smethurst agreed with me that the BBC’s opaque IDs — for example, b006qpgr for The Archers — could be promoted as a tag vocabulary that people would be encouraged to use:

Shownar is a prototype by Schulze and Webb that aims to track “buzz” around bbc programmes. For now it’s based on inbound links from blogs/twitter/etc but it could be expanded to use machine tags!?!

On Shownar, I find that this episode of Miss Marple was discussed in this blog entry:

BBC Radio have just started an Agatha Christie season and a whole host of programmes about the Queen of Crime are available to UK listeners on the iPlayer.

They include dramatizations of works starring super sleuths from Miss Marple to the Mysterious Mr Quin, as well as revealing documentaries.

The entry uses URLs that embed these BBC ids: b00mk71d, b007jvht. How did the author find them? Clearly, in this case, by way of the search URL which is also cited in the entry:

http://www.bbc.co.uk/iplayer/search/?q=agatha christie

The search term agatha christie is wildly ambiguous, of course. Shownar would never have included this item had it not cited specific BBC shows by way of their opaque IDs. Nor would the author have cited them if that had required typing b00mk71d or b007jvht. It only works thanks to copy/paste, but it works quite nicely, and it shows why site-specific search still matters in an era of uber search engines.

This example got me thinking about the character strings that we can and do type, easily and naturally, versus those we can’t and won’t. For example:

queries (what we can and do type) results (what we can’t and don’t type)
http://www.librarything.com/catalog/jonudell&deepsearch=
practical internet groupware

http://www.librarything.com/work/16804

http://www.librarything.com/work/16804/book/28447984

http://www.google.com/search?q=
practical internet groupware

http://oreilly.com/catalog/9781565925373

http://oreilly.com/catalog/pracintgr

http://www.bing.com/results.aspx?q=
practical internet groupware

http://www.amazon.com/Practical-Internet-Groupware-Jon-Udell/dp/156592537

http://my.safaribooksonline.com/1565925378

http://www.worldcat.org/search?q=
practical internet groupware

http://www.worldcat.org/oclc/43188074

http://www.amazon.com/s?index=blended&field-keywords=
practical internet groupware

http://www.amazon.com/Practical-Internet-Groupware-Jon-Udell/dp/1565925378


Looking at the consistency on the left column, and the variation on the right, I’ve got to conclude that:

  1. Practical Internet Groupware is the de facto webscale identifier for my book.

  2. 16804, 28447984, 9781565925373, pracintgr, 156592537, 1565925378, and 43188074 will never converge.

I’ve long imagined a class of equivalence services that would help us bridge the gap between vocabularies we can speak and write and those we’ll never speak and need help to write.

Both are sets of webscale identifiers that we’ll need to use in complementary ways. That’ll require a mix of social conventions and technical services.

Familiar idioms in Perl, Python, JavaScript, and C#

When I started working on the elmcity project, I planned to use my language of choice in recent years: Python. But early on, IronPython wasn’t fully supported on Azure, so I switched to C#. Later, when IronPython became fully supported, there was really no point in switching my core roles (worker and web) to it, so I’ve proceeded in a hybrid mode. The core roles are written in C#, and a variety of auxiliary pieces are written in IronPython.

Meanwhile, I’ve been creating other auxiliary pieces in JavaScript, as will happen with any web project. The other day, at the request of a calendar curator, I used JavaScript to prototype a tag summarizer. This was so useful that I decided to make it a new feature of the service. The C# version was so strikingly similar to the JavaScript version that I just had to set them side by side for comparison:

JavaScript C#
var tagdict = new Object();

for ( i = 0; i < obj.length; i++ )
  {
  var evt = obj[i];
  if ( evt["categories"] != undefined)
    {
    var tags = evt["categories"].split(',');
    for (j = 0; j < tags.length; j++ )
      {
      var tag = tags[j];
      if ( tagdict[tag] != undefined )
        tagdict[tag]++;
      else
        tagdict[tag] = 1;
      }
    }
  }
var tagdict = new Dictionary();

foreach (var evt in es.events)
  {

  if (evt.categories != null)
    {
    var tags = evt.categories.Split(',');
    foreach (var tag in tags)
      {

      if (tagdict.ContainsKey(tag))
        tagdict[tag]++;
      else
        tagdict[tag] = 1;
      }
    }
  }
var sorted_keys = [];

for ( var tag in tagdict )
  sorted_keys.push(tag);

sorted_keys.sort(function(a,b) 
 { return tagdict[b] - tagdict[a] });
var sorted_keys = new List();

foreach (var tag in tagdict.Keys)
  sorted_keys.Add(tag);

sorted_keys.Sort( (a, b) 
  => tagdict[b].CompareTo(tagdict[a]));

The idioms involved here include:

  • Splitting a string on a delimiter to produce a list

  • Using a dictionary to build a concordance of strings and occurrence counts

  • Sorting an array of keys by their associated occurrence counts

I first used these idioms in Perl. Later they became Python staples. Now here they are again, in both JavaScript and C#.