In U.N. Maps Show U.S. High in Gun Ownership, Low in Homicides, A.W.R. Hawkins presents the following two maps:

From these he concludes:
Notice the correlation between high gun ownership and lower homicide rates.
…
As these maps show, “more guns, less crime” is true internationally as well as domestically.
The second map depicts homicides per 100,000 people. That’s the same yardstick used in Steven Pinker’s monumental new book The Better Angels of Our Nature: Why Violence has Declined. Pinker marshals massive amounts of data to show that over the long run, and at an accelerating pace, we are less inclined to harm one another. When you look at the data on a per capita basis, even the mass atrocities of the 20th century are local peaks along a steadily declining sawtooth trendline.
One of the most remarkable charts in the book ranks the 20 deadliest episodes in history. It’s adapted from Matthew White’s The Great Big Book of Horrible Things, and appears in a slightly different form in The New Scientist:

Ever heard of the An Lushan Revolt? Well, I hadn’t, but on a per capita basis it dwarfs the first World War.
Pinker says, in a nutshell, that we’re steadily becoming more civilized, and that data about our growing reluctance to kill or harm one another show that. The trend marches through history and spans the globe. There’s regional variation, of course. A couple of charts show the U.S. to be about 5x more violent than Canada and the U.K. But there isn’t one that ranks the U.S. in a world context. So A.W.R. Hawkins’ map of homicide rates got my attention.
The U.S. has the most guns, the first chart says. And it’s one of the safest countries, the second chart says. But that second map doesn’t tell us:
Where does the U.S. rank?
How many countries are in the red, pink, yellow, and green categories?
Which countries are in those categories?
How do countries rank within those categories?
Here’s another way to visualize the data:
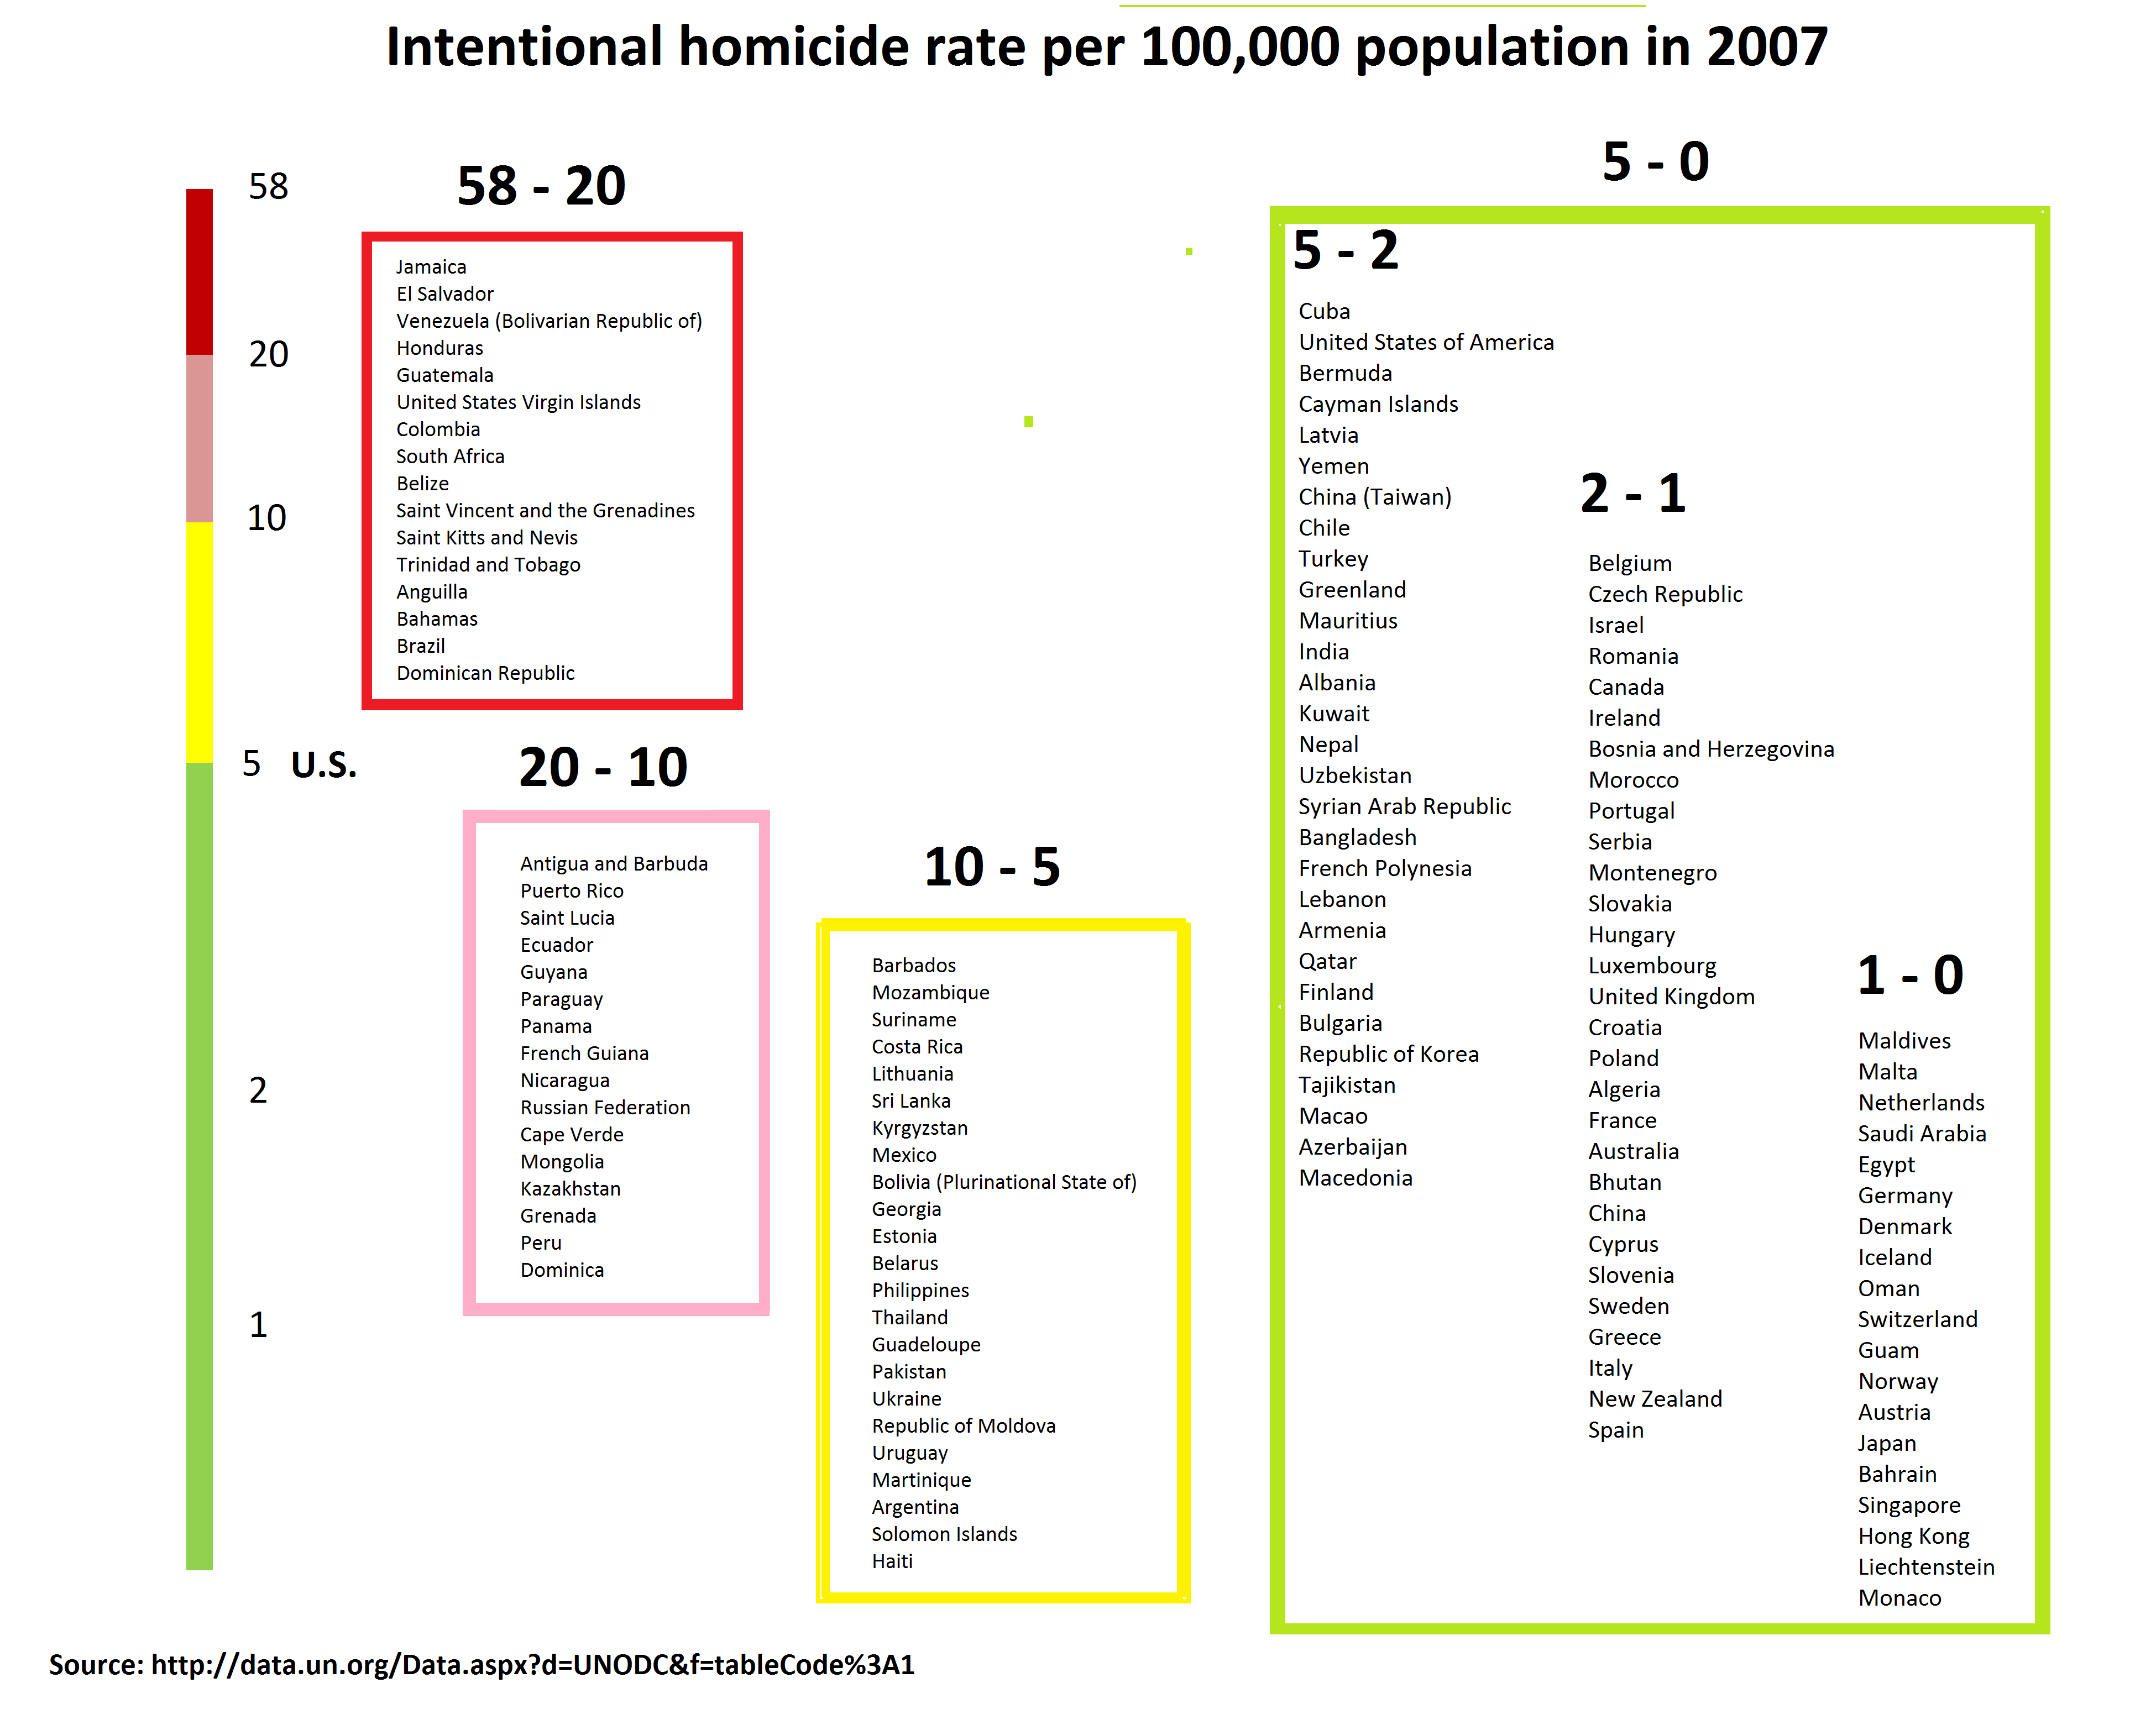
There are a lot of countries mashed together in that green zone. And after Cuba we’re the most violent of them. Five homicides per 100,000 isn’t a number to boast about.
The violence creeping from Mexico is a nightmare and its not just death by the gun.
culture .. would be very interesting to see graphics of the statistical breakdown by region district & socio-economic class a la Pierre Bourdieu’s marvelous book “Distinctions”
Five homicides per 100,000 which is a .00005% chance of dying by an intentional gun homicide which is far less than many other ways of dying in the US – given the massive disparity in gun ownership between the US and the other countries at or below 5, that is absolutely stunning.
I’d be interested to see these numbers in context of age groups, immigrant groups, and general personal freedom. It seems that for every country in green EXCEPT for the US, there is something that stands out – either the country a) has a rapidly declining population due to lack of young people (one of the likeliest factors to contribute to violence), b) does not experience much immigration and c) is ruled by an oppressive and totalitarian government.
Given the number of guns in the US, the relatively robust population growth (ie: lots of young people), a large immigrant inflow and a rather open, dynamic democracy, it is rather amazing the US has such a LOW amount of gun homicides.
That’s a really good observation.
No, sorry. For most of the “green” countries in Western Europe, the “declining youth population” is compensated by vigorous immigration flows, which bring predominantly young people into the country. So you have stable demographics (if anything, *growing* in some countries like the UK) *and* immigration-related issues in abundance, and still less than half the chance to be killed by a gun as in the US.
Still, the US is /such/ an outlier w/respect to # of guns — see for example http://do.minik.us/shorts/guns/guns.html — that one might, indeed, expect even more violence than we see.
Update: Hmm. If you uncheck non-OECD countries on the first chart on that page, the US does move to the upper right quadrant.
Given the relatively low chance of being a victim of intentional homicide, what is the need to own guns? As human society grows increasingly civilized, the propensity of death-inducing implements should diminish, no?
The second graph showing the ‘Deadliest Events in Human History’ suffers from a fatal flaw. Some of the events are spread over 1200 years (Mideast Slave Trade) and others over a much shorter period of time – 5 years for World War II. Comparing the total deaths over such vastly different time spans is very misleading.
Agreed, Not fatal to the point being made, I don’t think, but surely a flaw.
Using “Intentional homicides is not a good statistic. More likely depressed people will take the gun at home and kill themselves or children shooting each other thinking the gun is a toy. Add those numbers then try again.
Suicide is a complete non starter for your argument. Japan has a much higher suicide rate and functionally zero guns. Accidental death by firearms aren’t even in the top 10 causes… if you want to mandate away our rights to prevent accidental deaths ban swimming pools underneath the kitchen sink and drunk driving (oh wait, that’s already banned)