As Elm City hubs grow, with respect to both raw numbers of events and numbers of categories, unfiltered lists of categories become unwieldy. So I’m noodling on ways to focus initially on a filtered list of “important” categories. The scare quotes indicate that I’m not yet sure how to empower curators to say what’s important. Categories with more than a threshold number of events? Categories that are prioritized without regard to number of events? Some combination of these heuristics?
To reason about these questions I need to evaluate some data. One source of data about categories is the tag cloud. For any Elm City hub, you can form this URL:
elmcity.cloudapp.net/HUBNAME/tag_cloud
If HUBNAME is AnnArborChronicle, you get a JSON file that looks like this:
[
{ "aadl":348},
{ "aaps":9},
{ "abbot":18},
...
]
This is the data that drives the category picklist displayed in the default rendering of the Ann Arbor hub. A good starting point would be to dump this data into a spreadsheet, sort by most populous categories, and try some filtering.
I could add a feature that serves up this data in some spreadsheet-friendly format, like CSV (comma-separated variable). But I am (virtuously) lazy. I hate to violate the YAGNI (“You aren’t gonna need it”) principle. So I’m inclined to do something quick and dirty instead just to find out if it’ll even be useful to work with that data in a spreadsheet..
One quick-and-dirty approach entails looking for some existing (preferably online) utility that does the trick. In this case I searched for things with names like json2csv and json2xls, found a few candidates, but nothing that immediately did what I wanted.
So some text needs to be wrangled. One source of text to wrangle is the HTML page that contains the category picklist. If you capture its HTML source, you’ll find a sequence of lines like this:
<option value="aadl">aadl (348)</option>
<option value="aaps">aaps (9)</option>
<option value="abbot">abbot (18)</option>
It’s easy to imagine a transformation that gets you from there to here:
aadl	348
aaps	9
abbot	18
Although I’ve often written code to do that kind of transformation, if it’s a quick-and-dirty one-off I don’t even bother. I use the macro recorder in my text editor to define a sequence like:
- Start selecting at the beginning of a line
- Go to the first >
- Delete
- Go to whitespace
- Replace with tab
- Search for (
- Delete
- Search for )
- Delete to end of line
- Go to next line
This is a skill that’s second nature to me, and that I’ve often wished I could teach others. Many people spend crazy amounts of time doing mundane text reformatting; few take advantage of recordable macros.
But the reality is that recordable macros are the first step along the slippery slope of programming. Most people don’t want to go there, and I don’t blame them. So I’m delighted by a new feature in Excel 2013, called Flash Fill, that will empower everybody to do these kinds of routine text transformations.
Here’s a picture of a spreadsheet with HTML patterns in column A, an example of the name I want extracted in column B, and an example of the number I want in column C.
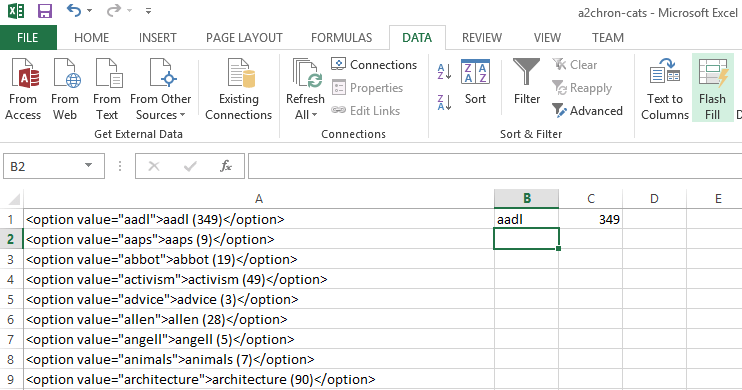
Given that setup, you invoke Flash Fill in the first empty B and C columns to follow the examples in B1 and C1. Here’s the resulting spreadsheet on SkyDrive. Wow! That’s going to make a difference to a lot of people!
Suppose your data source were instead JSON, as shown above. Here’s another spreadsheet I made using Flash Fill. As will be typical, this took a bit of prep. Flash Fill needs to work on homogenous rows. So I started by dumping the JSON into JSONLint to produce text like this:
[
    {
        "aadl": 348
    },
    {
        "aaps": 9
    },
    {
        "abbot": 18
    },
...
]
I imported that text into Excel 2013 and sorted to isolate a set of rows with a column A like this:
"aadl": 348
"aaps": 9
"abbot": 18
At that point it was a piece of cake to get Flash Fill to carry the names over to column B and the numbers to column C.
Here’s a screencast by Michael Herman that does a nice job showing what Flash Fill can do. It also illustrates a fascinating thing about programming by example. At about 1:25 in the video you’ll see this:
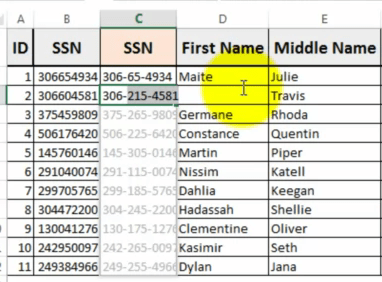
Michael’s example in C1 was meant to tell Flash Fill to transform strings of 9 digits into the familiar nnn-nn-nnnn pattern. Here we see its first try at inferring that pattern. What should have been 306-60-4581 showed up as 306-215-4581. That’s wrong for two reasons. The middle group has three digits instead of two, and they’re the wrong digits. So Michael corrects it and tries again. At 1:55 we see Flash Fill’s next try. Here, given 375459809, it produces 375-65-9809. That’s closer, the grouping pattern looks good, but the middle digits aren’t 45 as we’d expect. He fixes that example and tries again. Now Flash Fill is clear about what’s wanted, and the rest of the column fills automatically and correctly.
But what was Flash Fill thinking when it produced those unintended transformations? And could it tell us what it was thinking?
From a Microsoft Research article about the new feature:
Gulwani and his team developed Flash Fill to learn by example, not demonstration. A user simply shows Flash Fill what he or she wants to do by filling in an Excel cell with the desired result, and Flash Fill quickly invokes an underlying program that can perform the task.
It’s the difference between teaching someone how to make a pizza step by step and simply showing them a picture of a pizza and minutes later eating a hot pie.
But that simplicity comes with a price.
“The biggest challenge,” Gulwani says, “is that learning by example is not always a precise description of the user’s intent — there is a lot of ambiguity involved.
“Take the example of Rick Rashid [Microsoft Research’s chief research officer]. Let’s say you want to convert Rick Rashid to Rashid, R. Where does that ‘R’ come from? Is it the ‘R’ of Rick or the ‘R’ of Rashid? It’s very hard for a program to understand.”
For each situation, Flash Fill synthesizes millions of small programs — 10-20 lines of code — that might accomplish the task. It sounds implausible, but Gulwani’s deep research background in synthesizing code makes it possible. Then, using machine-learning techniques, Flash Fill sorts through these programs to find the one best-suited for the job.
I suspect that while Flash Fill could tell you what it was thinking, you’d have a hard time understanding how it thinks. And for that reason I suspect that hard-core quants won’t rush to embrace it. But that’s OK. Hard-core quants can write code. Flash Fill is for everybody else. It will empower regular folks to do all sorts of useful transformations that otherwise entail ridiculous manual interventions that people shouldn’t waste time on. Be aware that you need to check results to ensure they’re what you expect. But if you find yourself hand-editing text in repetitive ways, get the Excel 2013 preview and give Flash Fill a try. It’s insanely useful.
Interesting, very. I can see, though, that the non-hardcore folks – upon trying and seeing a wrong result – may just give up, thinking that “it’s broken.”
I’m curious to see how it plays out. It depends a lot on the source patterns. There’s a pretty large domain of really simple stuff that will be handled without any surprises.
Dear Jon,
Thanks for sharing the above story. Let me try the answer the two questions that you asked:
>But what was Flash Fill thinking when it produced those unintended transformations (in the SSN scenario)?
I tried the above scenario on my system, and it produces the intended transformations from just one example. I am pretty certain what is happening in the scenario is that there is some additional column on the right side of the worksheet (not shown in the picture) that has “65” as a prominent token in the first row.
> And could it tell us what it was thinking?
Yes, this is possible to do in theory. We can show the program that Flash Fill learned from examples. While the current release in Excel does not do this, hopefully we can expose this functionality in the future.
Please feel free to pass on any further feedback to me at sumitg@microsoft.com. I am especially looking for scenarios that Flash Fill does not currently support, but you wish it did. We can use those scenarios to drive our further research investment.
Best Wishes,
Sumit
http://research.microsoft.com/en-us/um/people/sumitg/
Let me add little bit more explanation on the SSN scenario. As I mentioned above, there is likely a hidden column on the right that has “65” as a prominent token in the first row. That column likely also has “215” as a prominent token in the second row. From the first example, Flash Fill thinks that “65” in the output column comes not from the first column, but from that hidden column on the right.
Have you thought of using XSLT via an xsl stylesheet that is generated or fixed matching your filter and view requirements. For most people opening the xml file will create a view (often tables) in a browser but right click on the xml file and open with Excel you get a spreadsheet option to use the specified stylesheet and very quickly you’ve got a spreadsheet. You can further style it with CSS. I use a macro enabled Excel file that makes Excel files from each xml file. It processes each xml file in a folder that either has no Excel equivalent or has an xml file that is newer than the Excel one.
However OpenOffice and LibreOffice don’t do this so well.
At one point I loved doing things that way. Now I’ll avoid it if at all possible!
Thanks for clearing that up, Sumit! I’ve relayed your comments to Michael’s YouTube page, maybe he can expand that window and show us the whole context. Anyway, kudos to you and your team, Flash Fill is not only a great innovation but one that I think will matter to a whole lot of people in very practical ways.