Facts and friction

Last weekend we all had a good chuckle when we saw that WolframAlpha knows — or anyway claims to know — the airspeed of an unladen swallow. But the more telling example, for me, was one that Stephen Wolfram showed in a post-demo discussion:

Suppose you want to know the distance to Pluto. We don’t just look it up. We answer the question: “What is the distance to Pluto right now?” And we compute the answer.

I reckon that this notion of computable knowledge is going to take a while to sink in. Here’s another example:

Q: length of grand canyon / height of mt. everest

A: 4.47.

These examples run the risk of seeming geeky and pointless. But twice in the last few days, I’ve found myself reaching for bits of computable knowledge that weren’t readily available, and that’s got me thinking about what things might be like when they are.

Both examples are from my elmcity+azure project. In one case, I needed to work out distances — based on latitude/longitude coordinates — for locations that might be written as Providence RI or Ann Arbor, MI. There’s no shortage of online services that can do this. But they all report results in different ways, and digging the answers out of XML responses — which may or may not require special handling for embedded namespaces — can be very tricky.

In the other case I wanted population data for cities whose names are written the same way. Here I wound up digging it out of a CSV file published at http://www.census.gov. It’s perfectly doable, but you’ve got to really want to do it. If you have, say, a count of calendar events in Providence, and you want to divide that by population in order to produce an experimental metric for creative class activity, you can’t just write “population of Providence RI” in the denominator and proceed with your experiment. You have to overcome some fairly serious data friction.

In a few months we’ll all get to tirekick WolframAlpha. Then we’ll draw our own conclusions about what it can or can’t do, and is or isn’t good for. I’m not expecting a Delphic oracle. But I would like to be able to compute with facts in a more frictionless way.

Competing for the creative class, revisited

In the current build of elmcity.cloudapp.net, the statistics page for each instance of the calendar aggregator reports a line like this one for Providence, RI:

All events 910, population 48779, events/person 0.02

I’m not exactly sure where this might lead, but I’m thinking that it could evolve into a population-independent metric of what Richard Florida calls “creative class” activity. As I learned at the Cities of Knowledge conference in 2007, city planners are now thinking explicitly about how to compete on the basis of such activity.

If you’re Asheville NC or Portsmouth NH, you can’t compete in absolute terms with San Francisco or New York. But you can compete with them on a relative basis. And you can also compete with similar-sized neighbors like Greenville NC and Dover NC. Here’s an early peek at the data:

city population events/person
keene, nh 23,000 0.07
ann arbor, mi 115,000 0.04
providence, ri 48,000 0.02

It’s not surprising that Keene ranks first, because I began the experiment in that town and have been curating its events for some time. But that’s exactly what interests me about this process.

I can’t measure the actual events-per-person ratio for these cities, because there’s no way to know know that. Most events aren’t reported in a machine-processable way, and so cannot be counted.

What a curator can do, though, is help make the creative class activity that’s really going on not just visible, but countable. Suppose that city A has less activity than B, but does a good job of curating what it has. City A might thereby create the impression that it has more. And by doing so, it might kick off a virtuous cycle that makes that impression real.

Are there any city planners who are gathering and using this kind of metric?

A conversation with Andrew Rasiej about activating student sysadmins, rebooting America, and designing for abundance

My guest for this week’s Innovators show is Andrew Rasiej. The show is a perfect example of what I envisioned a few years ago when I began looking for ways to mash up ITConversations with Social Innovation Conversations. Andrew is a social entrepreneur whose projects all, in one way or another, adapt technology to social need.

In this conversation we focus mainly on two of those projects. MOUSE advances the computerization and networking of schools by inviting students to become system and network administrators. The Personal Democracy Forum is an initiative to reboot politics.

From this interview, and from an earlier conversation with Andrew at Transparency Camp 2009, I took away two key principles:

1. Design for abundance. Activating student sysadmins and crowdsourcing political action are two of many examples where the gamechanging assumption is that resources and talent are abundant rather than scarce.

2. Be a lifelong learner. And to the extent you can, prefer to work with other lifelong learners.

There’s a bit of a conundrum here, because lifelong learners arguably are a resource that really is scarce. I’m still not sure how to think about that.

An assistive technology success story: The Humanware magnifier

As my mom wrestles with the difficult combination of hearing loss and vision loss, I’ve grown more aware of the strengths and weaknesses of various assistive technologies. Many are disappointing, but the Humanware magnifier is working well for her.

It’s basically a digital camera that projects onto a flatscreen monitor. You position your book or magazine on the flatbed, and zoom the onscreen text to the needed magnification.

As I watched her use the device I could see room for improvement. Although the bed slides laterally and longitudinally, the action is a bit stiff. So she tends to slide the reading matter around on the bed, rather than sliding the bed itself. As a result, she winds up realigning the book, newspaper, or magazine more than would otherwise be necessary.

With books, in particular, there’s also the issue of getting them to lie flat. I don’t think there’s any easy solution for that, but my mom’s OK with holding her books open on the bed.

There’s really only one test that matters: Can she read? And the answer is yes. My mom has been a lifelong voracious reader. Her macular degeneration had gotten to the point where she simply could not read, and that was devastating. Audiobooks help, but not much. That’s partly true because of hearing loss, and partly because the audio gadgets she’s tried — CD players, MP3 players — lack the affordances she needs.

The Humanware magnifier just works. There’s a big on/off switch, and a big zoom dial, and she can put a book, magazine, or newspaper onto the flatbed and read. Not nearly as fast as she’s capable of, but she can read. And so she does.

A conversation with Phil Windley about contextualized browsing

This week’s Innovators show has the lowdown on Phil Windley‘s new company, Kynetx. The first application of the Kynetx technology is Azigo’s RemindMe service. It alters search-results pages to highlight cases where the user has — but would likely have forgotten about — a discount-qualifying membership.

There are a number of moving parts in this scenario. On the back end, Kynetx provides a rules engine that decides how to rewrite a page based on the context of the user’s “web episode” and the user’s membership in an organization like AAA. Membership is asserted by an Information Card that the user installs, then presents on request to a browser extension. It asks the Kynetx service for a chunk of page-modifying JavaScript, then runs that code locally to effect the change specified by the rule.

If you’ve followed the Internet identity saga — a story that Phil has helped to write, as author of a book on digital identity and as an organizer of the Internet Identity Workshop — you’ll be thrilled to see that the Kynetx system is responsible for the minting and real-word use of Information Cards. As Phil explains in this interview, the cards as currently used convey no extra information, they merely signify membership. Still, it’s great to see this key technology finally percolate out into the mainstream.

Kynetx will mainly serve companies that want to solidify and enhance high-value relationships with customers by means of “permission-based context management.” Refreshingly, the Kynetx wiki qualifies that definition in a way that will make Doc Searls smile:

The following anti-lexicon contains words and concepts that Kynetx doesn’t use:

  • exploit – while opportunities might be exploited, people never should be.
  • eyeballs – we’re not doing optometry
  • target – you target enemies, not customers.

Near the end of the interview, Phil refers explicitly to Doc’s VRM (Vendor Relationship Management) campaign:

We see ourselves as plumbing for VRM. For example, we’re putting together a green choice card. If you install it, as you search around the web it will show you which companies have been ranked well or poorly in terms of social responsibility. Right now it’s just a demo, and we don’t have great data, but suppose we did, and there were enough of those cards out there, and Constellation Brands was determined by Fortune Magazine to be the least socially responsible company in 2008. If every time a cardholder found a Constellation product on Google there was a little icon indicating that, and there were a lot of people with the card, you could change the company’s behavior. They’d want to get the icon off that page.

It’s a fascinating notion, and it leads to an issue that I should’ve raised with Phil in the interview but will raise here instead. A couple of years ago, during my period of infatuation with Greasemonkey, I made a 4-minute screencast entitled Content, services, and the yin-yang of intermediation. At the time, I’d just invented a Greasemonkey-enabled version of LibraryLookup that was more aggressive than the standard bookmarklet version.

With the standard version, you click a bookmarklet while on an Amazon page, and a query against your local library pops up in a window. With the Greasemonkey-enhanced version, the Amazon page itself is rewritten to say:

“Hey! This book’s available at the Keene Public Library!”

Or:

“Due back at the Keene Public Library on March 28.”

But does the user of a web-based service have the right to modify pages in these ways? The screencast ponders that question. Three years ago there wasn’t enough client-side page rewriting going on to raise that question in a big way, and I guess there still isn’t, but now that jQuery is making the capability broadly available it’s bound to come up.

There’s a continuum of ways in which I can modify a web page in a browser, ranging from font enlargement to translation to contexual overlays. I wouldn’t draw a line anywhere along that continuum. It seems to me that I’m entitled to view the world through any lens I choose.

This doesn’t only apply to my view of the virtual world, by the way. It will apply to my view of the physical world too. We don’t yet have magic glasses that overlay web prices on shelf items, or web reputations on store signage, but someday we will.

I can’t see how I could be prevented from creating a heads-up display — for realspace or cyberspace — that’s advantageous to me. But I’ve got a hunch that those magic glasses are going to be controversial.

A new answer to an old question

Last week I started inviting calendar curators to join the elmcity+azure project. The age-old question immediately arose: How to communicate and collaborate? An email distribution list? A web forum? A blog? A wiki?

Been there, done that. Times are changing, and it felt like there ought to be a new answer to that old question.

Here’s the answer I came up with: a FriendFeed room. From my perspective, it’s an ideal solution. And fittingly, that’s true because it embodies the same principles woven into my elmcity project: syndication, publish/subscribe messaging, loose coupling.

I needed a lightweight system that would enable everyone involved in the project to be aware of, and optionally discuss:

  • Service updates
  • New locations
  • New feeds
  • Issues

So I created a FriendFeed room, and subscribed it to the following feeds:

It took about five minutes to set that up yesterday. I checked the room just now, and here’s what I saw:

In other words, Bill Rawlinson, who is curator for Huntington, WV, found — or, rather, created, using the increasingly awesome FuseCal — three new iCalendar feeds today. Those are three events of interest to the project. It should require near-zero effort for such event to come to the attention of project members. And when the workflow is syndication-enabled — as is automatically true for us, because we are using Delicious as the curation tool — it really does cost nothing to usefully propagate those events. The web hooks are already there, you just have to use them.

I have invited the curators into the room, and some have joined, but a crucial benefit of this arrangement is that nobody has to join unless there’s a need to actively discuss issues. To monitor the project’s event stream you can just go to the project’s FriendFeed room. Or don’t go. Because that stream is also, of course, available as a feed you can subscribe to.

It’s wildly cool, and incredibly useful. Thanks FriendFeed!

A conversation with Andrew Turner about data and design in the geospatial realm

I really chatting last week with Andrew Turner on my Innovators show. Andrew is the driving force behind GeoCommons, a new service that brings social curation and visualization to the realm of geographic information and cartography.

A lot of our discussion wasn’t specific to geographic data. Issues of provenance, data tethering, syndication, and interpretive context apply to any kind of data that lives online and is both produced and consumed by a lot of different people. As more kinds and quantities of data move into the public realm, we’ll discover and codify best practices for coordinating our efforts.

But we also, of course, talked about the special challenges of geographic data. Marrying temporal and spatial data is a huge one. As I mentioned here, the team at Stamen Design is doing great work on that front.

Of course we’ll want to encapsulate, in software tools, some of the chops that produce animated displays like their Oakland crimespotting map, or the Rocky Mountain Institute’s oil import map.

My own related effort was far less effective than that RMI oil import map. The best stories told with data will arc through time, and it needs to get way easier for anyone who cares to tell those stories.

As the tools and services emerge, we’ll run into another issue that Andrew and I discussed. Cartography is an incredibly subtle art, and we will soon see a proliferation of awful maps made by folks with data, tools, and no design sensibility. But that’s OK, in fact it’ll be a good problem to have. People went nuts with fonts and colors when the web was new, and everyone suddenly became a publisher. Over time things have settled down. It’ll be interesting to watch the cycle repeat as everyone becomes a mapmaker.

Revisiting FuseCal and Upcoming

As calendar curators begin bringing the elmcity project to life in their communities, they’re broadening my horizons. Last year, for example, in the comments on this entry, I learned about FuseCal, a calendar-publishing service that can extract structured calendar information from semi-structured web pages. I’ve been using FuseCal ever since, but in my community I’ve only found one otherwise-inaccessible calendar that it can successfully parse. Curators in other communities, however, are finding more. The Baltimore list includes a handful of them, and so does the Huntington, WV list.

In that comment thread, I tweaked FuseCal’s product manager Matt Gillooly when I said that a service based on HTML screenscraping shouldn’t need to exist. His reply was spot on:

I agree that, ideally, FuseCal wouldn’t have to exist — in the same way that, ideally, hospitals and prisons wouldn’t have to exist. :-)

Seriously, though, I think you need to provide a lot of incentive in order to get people to change the way they behave. It’s much easier to sell a Tylenol than a vitamin.

Matt’s right, of course. My goal for this project is to bootstrap networks of calendar feeds in communities. What matters is lighting up feeds, much more than how they get lit. So it’s great to see FuseCal lighting up feeds in Baltimore and Huntington.

Another service that has seen limited use in my own community, but will be more important elsewhere, is Upcoming. It’s ironic because back in 2005, when I first started thinking about this stuff, Upcoming was the model for what I hoped would emerge in Keene. I walked around town that spring, took photos of event posters, noticed how little of that information was available online, and wondered what it would take to fix that. I’d been using Upcoming myself, but hadn’t had much success getting anyone else involved.

In a blog entry I mused about ways to improve the service. One of my suggestions was to provide an API, and Upcoming’s founder Andy Baio heard and responded.

Four years later there still aren’t many Upcoming events for Keene. But as other communities come online, I’m finding that Upcoming is more popular there. So I’ve added it to the mix, and am finally using the API I asked for long ago.

The elmcity service now supports three major sources of events:

  1. A curated list of iCalendar feeds
  2. Eventful
  3. Upcoming

The Eventful and Upcoming sources are governed by three bits of Delicious-tagged metadata. For Keene, they are:

radius=15
lat=42.9336
lon=-72.2786

Both services support queries that, if written in English, would say: “Give me all the events within 15 miles of Keene.”

Won’t there be duplication? Sure, and here’s an example from the Keene calendar.

Sun 05:00 PM Caribbean Night with Steel Drum music
(eventful: Inn at East Hill Farm)

Sun 05:00 PM Caribbean Night
(upcoming: The Inn at East Hill Farm)

I regard this as a good problem to have. Seeing an event from multiple sources is infinitely better than never seeing it at all. Over time I’ll look for ways to coalesce these duplicates. But for now, given that the vast majority of events aren’t being posted online in any structured way, I like showcasing the many ways to do that.

The Floating Arms keyboard

From an article in today’s NY Times by my friend Peter Wayner:

Some people are so devoted to their keyboard that they search for backups and worry about finding another copy of a discontinued version. Jon Udell, a senior technical evangelist for Microsoft who suffers from repetitive stress problems, uses a Floating Arms keyboard last manufactured in the 1990s. The device incorporates the left part of the keyboard into the left armrest and the right half into the right armrest. The weight of the arms is carried by the rests, which put the hands in the optimal position to stroke the keys. It is the ultimate synthesis of easy chair and keyboard.

“[If you are a touch typist] your hands never cross the center line anyway,” explained Mr. Udell. “This way you take all the weight off your shoulders, all the tension off your neck, you straighten your back, and you breathe better.”

What will he do if it breaks? He hopes someone else builds another version because nothing else comes close for him.

“It’s been a godsend and I don’t know what I’ll do without it,” he said, fingers crossed.

Here’s the picture of my beloved “Captain Kirk chair” that we ran in BYTE in 1996:

The Floating Arms Keyboard, from Workplace Designs ((612) 439-4474), addresses postural problems associated with the traditional desk, keyboard, and chair. A BYTE editor found that switching to this keyboard greatly reduced work-related pain.

From that article:

Understanding keyboards is a complex research task. “That is because the problem is multifactoral,” says Cathy Mishek O’Brien, president and CEO of Workplace Designs (Stillwater, MN), which sells the Floating Arms Keyboard.

Thanks again Cathy. If you should happen to find this, I’d love to hear more from you about the story of this product: how it was developed, why it was discontinued. It’s hard for me to understand why a product that was so revolutionary, and is so effective, didn’t succeed.

Searching for calendar information

WHAT AND WHY

With the community calendar service now live, I’ve got to do a bit more work to make it fully data-driven. Since I’m already managing the per-community feed lists and metadata on Delicious, I figure I might as well go all the way. So I’m keeping a list of the Delicious accounts that control each community’s calendar aggregator on Delicious too. Today there are three. The idea is that when I add the fourth, I won’t touch any code — or even configuration data — that will require an update to the running service. I’ll just bookmark a fourth Delicious account and tag it with calendarcuration.

But that’s merely an administrative convenience. Much more critical, at this point, is to help curators find machine-readable calendars in their communities and — since most of the calendars that might exist don’t — also show people how they can easily create them.

I got a running start when I bootstrapped the Ann Arbor instance, thanks to Google Calendar. I searched for Ann Arbor there and found a nice list of iCalendar feeds. But that search feature is, at least for now, gone.

Several curators have tried searching the web for .ICS files (e.g. filetype:ics), but that’s not very productive for a couple of reasons. Where iCalendar resources do exist, they often aren’t exposed as files with .ICS extensions. But more importantly, relative to the number of iCalendar resources that could exist, very few actually do.

So I thought back on how I bootstrapped the original Keene instance. A number of the events there are recurring events that were advertised on the web, but not in any structured format. I found them one day by doing web queries like:

"first monday" keene
"every thursday" keene

There’s no fully automatic way to convert this stuff into structured calendar data. But it’s pretty straightforward to fire up a calendar program, enter some recurring events, and publish a feed. The advantage of recurring events, of course, is that they keep showing up, which is very helpful if you’re trying to build critical mass.

So I’m now envisioning a pair of tools to help curators do this more easily. First, I’d like to have each community’s aggregator running a scheduled search that helps the curator be aware of calendar-like information that could be upgraded to actual calendar data. Second, I’d like to provide a tool that partly automates the cumbersome data entry.

I’ve done an initial version of the search tool, and an example of its output is here. I’ll attach the code to the end of this item, for those who care, although I expect that if it winds up being useful to curators, most will appropriately not care, and will only want to scan the links now and then.

It may be interesting, over time, to try to evolve this into a robot that makes sense of the calendar information that people actually write, as opposed to the information that calendar programs constrain them to produce. But meanwhile this hybrid approach seems like a way to make progress.

HOW

I did this tool in two parts. The kernel, so to speak, is in C#, because for now that’s the most practical way to write Azure services and applications. But the application is in IronPython, because the search function doesn’t yet need to be hosted on Azure, and IronPython is a really flexible and convenient way to experiment with the kernel.

The C# piece uses James Newton-King’s Json.NET library because JavaScript interfaces are now the preferred way to search programmatically. It’s been a while since I’ve done this kind of thing. Used to be, the REST APIs were easy to find. But now, since those interfaces are mainly intended for use by JavaScript objects embedded in web pages, I had to do a bit of spelunking.

One of the interesting things about Json.NET is that it includes an implementation of LINQ for JSON. That’s why you see the “from … select” syntax, which extracts an enumerable list of URLs from the JavaScript results returned by the search services.

using System;
using System.Collections.Generic;
using System.Linq;
using Newtonsoft.Json;
using Newtonsoft.Json.Linq;

namespace CalendarAggregator
{
  public class Search
    {
    public List<string> search_result_urls;
    public Dictionary<string, int> dict;

    public List<string> livesearch(string query)
      {
      var url_template =  "http://api.search.live.net/json.aspx?AppId=XXX& \
          Sources=web&Query={0}&Web.Count=50";
      var offset_template = "&Web.Offset={1}";
      var search_url = "";
      int[] offsets = { 0, 50, 100, 150 };
      foreach (var offset in offsets)
        {
        if (offset == 0)
          search_url = string.Format(url_template, query);
        else
          search_url = string.Format(url_template + 
            offset_template, query, offset);

        var page = Utils.FetchUrl(search_url).data_as_string;
        JObject o = ( JObject) JsonConvert.DeserializeObject(page);

        var urls =
          from url in o["SearchResponse"]["Web"]["Results"].Children()
            select url.Value<string>("Url").ToString();

        dictify(urls);
        }
      return new List<string>();
    }

    public List<string> googlesearch(string query)
      {
      var url_template = "http://ajax.googleapis.com/ajax/services/search \
          /web?v=1.0&rsz=large&q={0}&start={1}";
      var search_url = "";
      int[] offsets = { 0, 8, 16, 24, 32, 40, 48 };
      foreach (var offset in offsets)
        {
        search_url = string.Format(url_template, query, offset);
        var page = Utils.FetchUrl(search_url).data_as_string;
        JObject o = (JObject)JsonConvert.DeserializeObject(page);

        var urls =
          from url in o["responseData"]["results"].Children()
             select url.Value<string>("url").ToString();

        dictify(urls);
        }
      return new List<string>();
    }

  private void dictify(IEnumerable<string> urls)
    {
    foreach (var url in urls)
      {
      if (dict.ContainsKey(url))
        dict[url] += 1;
      else
        dict[url] = 1;
      }
    }
  }
}

Here’s the IronPython piece which uses the search methods from the C# code:

import clr
clr.AddReference("CalendarAggregator")

locations = [
'ann arbor',
'huntington wv',
'keene'
'virginia beach',
]

qualifiers = [
'first',
'second',
'third',
'fourth',
'every'
]

days = [
'monday',
'tuesday',
'wednesday',
'thursday',
'friday',
'saturday',
'sunday'
]

for location in locations:
  search = Search()
  for qualifier in qualifiers:
    for day in days:
      q = '"%s" "%s %s"' % ( location, qualifier, day )
      search.googlesearch(q)
      search.livesearch(q)

for key in search.dict.Keys:
  print key, search.dict[key]

Calling calendar curators

The elmcity+azure project is live today at elmcity.cloudapp.net. The service is currently gathering and organizing online calendars for two towns: Keene, NH and Ann Arbor, MI. I’m keeping the list of iCalendar feeds for Keene, and Ed Vielmetti is keeping the list for Ann Arbor.

If you’d like to play along in your town, just pick a Delicious account, bookmark all the useful iCalendar feeds you can find, plug in some metadata, and point me to the account. I’ll register it with the service, which will:

  • Regularly parse the iCalendar feeds in your list.
  • Report numbers of events found in the feeds, or details of errors encountered.
  • Scan Eventful.com for events in your specified location.
  • Merge all the events.
  • Publish an HTML view of the merged calendar, based on the HTML template and CSS file that you specify.
  • Produce JSON and XML views of the merged data.
  • Serve up an embeddable JavaScript widget for just the current day.

If you decide to try curating one of these lists, you’ll quickly find, as I have, that there are no major technical hurdles. True, there are some issues with invalid iCalendar feeds. But that’s not what prevents us from having a comprehensive view of all the public events happening where we live. The real challenge is explaining how to publish useful calendars using free, ubiquitous tools, why posting a PDf to the website isn’t good enough, and what network effects can happen when more of us publish and syndicate calendar feeds.

It’s a big challenge. But progress in this domain can generalize to others. When I discussed this project at Transparency Camp, Greg Elin said: “OK, so you’re not trying to get people to adopt a technology, you’re trying to get them to adopt a pattern.”

That’s it exactly. This pattern of collaborative curation isn’t yet well understood or widely practiced. But it’s a key strategy that Internet citizens can use to enhance collective awareness and enable collective action. So if you try this experiment, I’m most interested to know what words, images, behaviors, or demonstrations help you get that idea across.

Hosted lifebits meets infobus

Doug Purdy is thinking out loud about the principles, scenarios, architecture, and software necessary for what he calls infobus and what I have called hosted lifebits. I started to respond in comments on Doug’s blog, but of course that subverts what I declare to be a core principle, namely syndication.

There’s a crucial difference between a) committing my words to Doug’s blog, and b) committing my words to my own lifebits stream and then syndicating them to Doug’s blog. We don’t see it very clearly yet because we lack the mechanism for b).

I can kinda get the effect of syndication by referring to Doug’s blog entry from mine, and hoping that his blog engine will notice and acknowledge. But a truly syndication-oriented mechanism would imply that I publish in my own space, and then — in Doug’s space — actively subscribe back to myself. To explicitly comment on Doug’s entry, in other words, I don’t type words into his comment form. I create a subscription associated with my identity (as a conventional comment always is) that points back to my feed.

Let’s consider Doug’s point #4: “You determine if/when/how this data is accessed, the terms of use and the revocation of the license.” If I comment on Doug’s blog, I can hope for ex post facto control of my words, but whatever agreement may be (tacitly or explicitly) in place, the architecture doesn’t support that control. I may or may not be able to revise or extend my remarks. And Doug can certainly revise, extend, or delete — it’s his blog.

If I syndicate to Doug’s blog, there is still only a hope of ex post fact control, not a guarantee. But the architecture is at least aligned in my favor. The effort I invest in writing on Doug’s blog, or a bunch of other blogs, is preserved. I can archive, organize, and search all my stuff. I don’t need to depend on services Doug’s blog may or may not offer to find out who is reading and reacting to my stuff. And if I want to withdraw my comment, I just revoke the permission I gave Doug’s blog service to syndicate from mine.

Realistically, that revocation won’t erase my contribution to Doug’s blog. My words may have been quoted there, in other comments, and the mixing process dilutes control — which I argue is a feature, not a bug. But if the default is to syndicate by reference, rather than by value, the architecture favors the kind of control we want.

To clarify what I mean by favoring the right kind of control, let’s switch to a medical information scenario. Recently I had a dental xray. The image lives on the dentist’s hard drive. I want it to work differently. When I show up at the dentist’s office, I want to give the xray technician a token that grants her machine access to my lifebits store. The machine publishes the image to my store. I, in turn, agree to syndicate the image back to the dentist — maybe to copy, but maybe only to view.

One interesting benefit of this arrangement is that I’m decoupling dental service from image storage service. Maybe I’ll just turn around and reconnect them, because maybe I’d rather just let the dentist bundle those services. But when I interpolate my lifebits store into the pipeline, I guarantee portability to another dentist.

Another benefit is clarity of ownership and syndication rights. My lifebits store will have a management service where I declare, review, and adjust all of the syndication relationships between my lifebits streams and the services they participate in. And this management service can not only implement my ownership and syndication policies, it can announce them to the world. It can be the place where I say who gets to do what with my stuff. Some of those policy assertions will be private, but many will be public. Ultimately, again, there is no guarantee of ex post facto control. But if you violate my terms, it will be easier for me, or anyone, to determine that you have done so.


PS: Coincidentally, or maybe not, Doug was my guest on last week’s Innovators show. The topic was “Oslo”. But the context was our shared passion for figuring out how computers, information systems, and networks can more easily and more faithfully express the intentions of the people who own, operate, and inhabit them.

Cornell is WIRED!

I spent last weekend in DC at Transparency Camp, which turned out to be one of the best cultural mashups I’ve attended in a long time. If we can get federal policy wonks and Silicon Valley tech geeks working together in the right ways, there’s good reason to hope that our government can become not just more transparent, but also more effective, more collaborative, more democratic.

A central theme was access to the operational data of government. What kinds of structured or narrative data exist, or could exist? When government doesn’t publish the stuff, how can activists extract it? When government does publish it, how can that be done most usefully? When the information is made available, one way or another, how can citizens, journalists, and government itself make use of it?

In my own work, I’ve been asking and trying to answer these questions. The event validated my efforts, and connected me to a flood of relevant people, ideas, tools, and techniques. That’s what you hope to get out of a conference, and it’s what this one delivered in spades.

But it also brought something else into sharp focus. To explain, I have to revisit 1994. In that seminal year, Microsoft famously “got” the Web. As BusinessWeek reported two years later:

The Web-izing of Microsoft begins in February, 1994, when Steven Sinofsky, Gates’s technical assistant, returned to his alma mater, Cornell University, on a recruiting trip. Snowed in at the Ithaca (N.Y.) airport, he headed back to the Cornell campus. That’s when he saw it: students dashing between classes, tapping into terminals, and getting their E-mail and course lists off the Net.

The Internet had spread like wildfire. It was no longer the network for the technically savvy — as it had been seven years earlier when Sinofsky was studying there — but a tool used by students and faculty to communicate with colleagues on campus and around the world. He dashed off a breathless E-mail message called “Cornell is WIRED!” to Gates and his technical staff.

Fifteen years on, the Net is as pervasive as air, as fundamental as gravity, as nourishing as sunlight — at least for the billion of us lucky enough to be online.

But while the architecture of the Net is firmly established, the architecture of communication and collaboration enabled by the Net is still very much up for grabs. Key principles, best practices, and effective patterns are still emerging.

For many years I have been a discoverer, early adopter, and explainer of those principles, practices, and patterns. And I’ve wondered: What would it would be like if you didn’t have to discover, adopt, and explain this stuff? What would it be like if you could just take it for granted, and just use it, in an environment where everybody else was using it too?

It would be like Transparency Camp 09.

This wasn’t the first event I’ve been to where Twitter was pervasive. But it was the first I’ve been to where tech geeks weren’t the only ones Twittering. The policy wonks were too. Everyone was tuned into the #tcamp09 channel. And, in fact, everyone still is. The conference “ended” on Sunday, it’s Thursday, but a half-dozen new items appeared on that channel since I started writing this essay. I particularly like this one:

Funny. Someone from #tcamp09 lives in my building. She says, “Didn’t we meet this weekend?” “No.” “You’re…cheeky something?” “OH…yes”

That’s a nice example of manufactured serendipity. I coined the phrase in another era. Back then, the new phenomenon called blogging was the realm in which we were discovering, adopting, and explaining the crucial principles, patterns, and practices. Now the action has moved to Twitter. But they’re the same principles, patterns, and practices:

  1. The principle of conserving keystrokes
  2. The pattern of publishing and subscribing
  3. The practice of narrating your work

In 1994 Steve Sinofsky saw the arrival of the Net, and sent email to tell Microsoft about it. In 2009 I see the emergence of a transformative way of using the Net. I could try sending email to tell Microsoft about it, and that would still be the preferred method. But email is no longer the engine that will drive radical improvement. What’s more, it often subverts the right principles, patterns, and practices.

So how does Microsoft, or any large enterprise — e.g., the government — embrace a new architecture of communication and collaboration? Slowly at first, but inexorably, and with profound effects in the long run. I can’t alter the timetable. But this is an interesting moment, and I simply want to observe, mark, and note it.

A demonstration calendar for Ann Arbor, Michigan

Following up on yesterday’s entry, here is an instance of the calendar aggregator for Ann Arbor, Michigan, a town I lived in for a long time and remember fondly: Events in and around Ann Arbor.

It’s controlled by a Delicious account — delicious.com/a2cal — which I’ll happily relinquish to a more appropriate curator.

There are two primary sources of information. First, events posted to Eventful.com at locations within 15 miles of Ann Arbor. Second, Google calendars that turn up in a search for Ann Arbor.

My notion was that this would be a nice way to bootstrap an instance of the aggregator. Not all the Google calendars will be appropriate, and there are of course many other iCalendar feeds that I don’t know about and can’t easily find. But there’s enough here to serve as a proof of concept, and maybe attract the interest of one or more curators. As a curator, you’d do things like:

  1. Tweak the template and the image. (Josh Band, I cropped your photo just as a placeholder, hope that’s OK.)
  2. Weed out inappropriate feeds.
  3. Add new feeds.
  4. Edit feed titles, and provide url=http://HOMEPAGE tags so that all events link somewhere.

Unfortunately, just as I was gearing up to roll out this approach, the Search Public Calendars feature of Google Calendar went AWOL. (Perhaps, as one commenter suggests, as a security measure.) I had searched out Ann Arbor iCalendar feeds a couple of weeks ago, and saved the list, but that procedure isn’t repeatable now for Ann Arbor or anywhere else.

In any case, I hope this illustrates the idea. One or more curators maintain a list of feeds for a community, and the service aggregates them. If you’d like to play along, create a Delicious account along the lines of delicious.com/elmcity or delicious.com/a2cal and let me know about it.

Collaborative curation as a service

This week my ongoing fascination with Delicious as a user-programmable database took a new turn. Earlier, I showed how I’m using Delicious to enable collaborative curation of the set of feeds that drives an aggregation of community calendars.

The service I’m building in this ongoing series has so far collected calendars only for a single community — mine. But the idea is to scale out so that folks in other communities can use it for their own collections of calendars.

As I refactored the code this week to prepare for that scale-out, I thought about how to manage the configuration data for multiple instances of the aggregator. This is a classic problem, there are a million ways to solve it, and I thought I’d seen them all. But then I had a wacky idea. If I’m already using Delicious to enable community stakeholders to curate the sets of feeds they want to aggregate, why not also use Delicious to enable them to manage the configuration metadata for instances of the aggregator?

Here’s a way to do that. Consider this URL:

http://delicious.com/elmcity/metadata

It refers to an URL that doesn’t actually point to anything — click it and you’ll see that for yourself. So it’s really an URN (Uniform Resource Name) rather than an URL (Uniform Resource Locator).

But even though it doesn’t point to anything, it can still be bookmarked. The owner of the elmcity account on Delicious can click Save a Bookmark and put http://del.icious.com/elmcity/metadata into the URL field.

Now you can attach stuff to the bookmark, like so:

Here the title of the bookmark is metadata, and the tags are these strings:

tz=Eastern
title=events+in+and+around+keene
img=http://elmcity.info/media/keene-night-360.jpg
css=http://elmcity.info/css/elmcity.css
contact=judell@mv.com
where=keene+nh
template=http://elmcity.info/media/tmpl/events.tmpl

These strings are, implicitly, name=value pairs. The service that reads this configuration data from Delicious can easily make them into explicit names and values. But how does it find them? By looking up the metadata URL, like so:

delicious.com/url/view?url=http://delicious.com/elmcity/metadata

That request redirects to the special Delicious URL that uniquely identifies the bookmark:

delicious.com/url/9ee9d2e51e4f36d4d49207e1675b3cbb

Of course the service doesn’t want to dig the name=value pairs out of that web page. So instead it reads the page’s RSS feed:

feeds.delicious.com/v2/rss/url/9ee9d2e51e4f36d4d49207e1675b3cbb

To prove that it works, check out this prototype version of the elmcity calendar. That page was built by an Azure service that reads configuration data from the bookmarked URN, and interpolates the name=value pairs into the template specified in the metadata.

Is this crazy? Here are some reasons why I think not.

First, I’m embracing one of a programmer’s greatest virtues: laziness. Why write a bunch of database and user-interface logic just to enable folks to manage a few small collections of name=value pairs? Delicious has already done that work, and done it much better than I could.

Second, the configuration data lives out in the open where stakeholders can see it, touch it, and collaboratively manage it. There are all kinds of ways Delicious can help those folks do that. For example, anyone who cares about this collection of data can subscribe to its feed and receive notifications when anything changes.

Third, it’s easy to extend this model. For example, part of the workflow will entail one or more stakeholders deciding to trust a feed and put it into production. As you may recall, the service trusts a feed when it’s bookmarked with the tag trusted. Part of that approval process will involve making sure that there are URLs associated with events coming from the feed. Some iCalendar feeds provide them, but many don’t.

So in addition to the configuration that’s needed once for each instance of a community aggregator, there’s a bit of configuration that’s needed once per feed. If a feed doesn’t provide URLs for individual events, you can at least provide a homepage URL for the feed. And this piece of metadata can be managed in the same way. Here’s the bookmark for the Gilsum church. It carries the tag url=http://gilsum.org/church.aspx. As you browse around in a set of trusted feeds, it’s pretty easy to see which ones do and don’t carry those tags, and it’s pretty easy to edit them.

It all adds up to a ton of value, and to capture it I only had to write the handful of lines of code shown below.

Now I’ll grant this way of doing things won’t work for everybody, so at some point I may need to create an alternative. And since I don’t want to depend on Delicious being always available, I’ll want to cache the results of these queries. But still, it’s amazing that this is possible.


public Dictionary<string, string> 
  get_delicious_feed_metadata(string metadata_url, string account)
  {
  var dict = new Dictionary<string, string>();
  var url = string.Format("http://delicious.com/url/view?url={0}", 
    metadata_url);
  var http_response = Utils.FetchUrlNoRedirect(url);
  var location = http_response.headers["Location"];
  var url_id = location.Replace("http://delicious.com/url/", "");
  url = string.Format("http://feeds.delicious.com/v2/rss/url/{0}", 
    url_id);
  http_response = Utils.FetchUrl(url);
  var xdoc = Utils.xdoc_from_xml_bytes(http_response.data);
  string domain = string.Format("http://delicious.com/{0}/", account);
  var categories = from category in xdoc.Descendants("category")
                   where category.Attribute("domain").Value == domain 
                   select new { category.Value };
  foreach (var category in categories)
    {
    var key_value = Utils.RegexFindGroups(category.Value, 
      "^([^=]+)=(.+)");
    if (key_value.Count == 2)
      dict[key_value[0]] = key_value[1].Replace('+', ' ');
    }
  return dict;
  }

A conversation with Mark Baker about RESTful principles

My guest on this week’s Innovators show is Mark Baker. All of us who celebrate the web owe Mark a debt of gratitude for passionately articulationg key RESTful principles — uniform interfaces, statelessness, hyperlinked representations — back when they were a lot more controversial than they are now.

Mark worried about the interview because he had a wicked cold at the time, and actually so did I. But thanks to the miracle of audio editing, it came out quite well!

Yes We Scan: Carl Malamud for Public Printer of the US

Carl Malamud believes that he’d make a great Public Printer of the United States. And he’s right. There is nobody on the planet more qualified to reinvent the Government Printing Office, and there’s never been a time when that mattered more.

Of course nobody’s asked him. But meanwhile, over here, he’s doing the job, and he’ll keep doing it no matter what.

From the New York Times:

“If called, I will certainly serve,” he said. “But if not called, I will probably serve anyway.”

I hope he gets the call.

PS: A lot of folks have done interviews with Carl. Here’s mine.

Introducing SpokenWord.org

Back in the good old days, circa 2006 or so, I was a happy podcast listener. During my many long periods of outdoor activity — running, hiking, biking, leaf-raking, snow-shoveling — I sometimes listened to music, but more often absorbed a seemingly endless stream of spoken-word lectures, conversations, and entertainment. Some of my sources were conventional: NPR (CarTalk, FreshAir), PRI (This American Life), BBC (In Our Time), WNYC (Radio Lab). Others were unconventional: Pop!Tech, The Long Now Foundation, TED, ITConversations, Social Innovation Conversations, Radio Open Source.

But once I caught up with these catalogs, there wasn’t enough of the right kind of new flow to provide the intellectual companionship that enriches my solo excursions. That’s problem number one.

Problem number two is more mundane, but still vexing. I’m subscribed to all the aforementioned feeds (and more) in iTunes. When I update them, I wind up taking a screenshot like this:

Why? Because although the downloads window conveniently lists all the shows I want to hear over the next day or so, this view evaporates once the files are downloaded. The shows retreat to separate branches of the iTunes tree. And I can never remember which branches I need to visit in order to copy those files to my trusty Creative MUVO MP3 player. In this case, the branches are Pop!Tech, Long Now, This American Life, and Radio Lab. But there are a bunch of others too, hence the need for this accounting hack.

So far, SpokenWord.org is more helpful with the second problem than with the first. I’m using it to consolidate feeds. From the FAQ:

Think of SpokenWord.org as a funnel. You collect streams (RSS feeds) of programs from all over the Web, then combine them into a singe collection on SpokenWord.org. Then in iTunes you subscribe to just one feed: the feed from your SpokenWord.org collection.

Managing feeds, in addition to (or instead of) managing items, is an aspect of digital literacy that’s only just emerging. I think it’s critical, so I’m a keen observer/participant in various domains: blogging, microblogging, calendaring, or — in this case — audio curation. The notion of a podcast metafeed comes naturally to me. But I’m curious about who will or won’t adopt the practice. It entails a level of indirection which, as we know, can be a non-starter for a lot of folks.

What about the first problem? I’m hoping that SpokenWord will become a place where curators emerge who lead me to places I wouldn’t have gone. That’s what thrilled me about Webjay, five years ago. The world wasn’t ready for collaborative curation then, and the domain of music was (and is) encumbered. But we’re five years on, and most of the spoken word audio that might usefully be curated is unencumbered. Maybe the time is right for folks like OddioKatya — my favorite webjay on Webjay, back in the day — to build reputations and followings in the domain of spoken word audio.

That hasn’t happened yet, of course, since SpokenWord.org just launched in beta this week. Meanwhile, the site offers a variety of lenses through which to view its growing collection of feeds and programs: tags, categories, ratings, user activity. So far I’m finding the activity to be most helpful. I’m either already familiar with, or not interested in, much of what I see. But the Active Collectors bucket on the home page has alerted me to a couple of feeds I hadn’t known about, notably BBC World’s DocArchive.

Disclosure: I am on the ITConversations Board of Directors. At a meeting last summer, a consensus emerged to focus on collaborative curation rather than original production. My contribution has been to connect Doug Kaye with Lucas Gonze (Webjay) and Hugh McGuire (LibriVox — two useful points of reference — and to try to help Doug clarify how curation can happen in this realm.

For me, SpokenWord.org in its current form is very useful for feed consolidation, and not yet quite as useful for discovery and curation. All these aspects will surely evolve as more people engage with it. I’ll be curious to know what those who listen to spoken word podcasts — and those would like to curate them — think about the service.

Using the Azure table store’s RESTful APIs from C# and IronPython

In an earlier installment of the elmcity+azure series, I created an event logger for my Azure service based on SQL Data Services (SDS). The general strategy for that exercise was as follows:

  1. Make a thin wrapper around the REST interface to the query service
  2. Use the available query syntax to produce raw results
  3. Capture the results in generic data structures
  4. Refine the raw results using a dynamic language

Now I’ve repeated that exercise for Azure’s native table storage engine, which is more akin to Amazon’s SimpleDB and Google’s BigTable than to SDS. Over on GitHub I’ve posted the C# interface library, the corresponding tests, and the IronPython wrapper which I’m using in the interactive transcript shown below.

As in the SDS example, I’m using the C#-based library in two complementary ways. My Azure service, which currently has to be written in C#, uses it to log events. But when I want to analyze those logs, I use the same library from IronPython.

I haven’t made a CPython version of this library, but it would be straightforward to do so. More generally, I’m hoping this example will help anyone who wants to understand, or create alternate interfaces to, the Azure table store’s RESTful API.


>>> from tablestorage import *

>>> list_tables()
['test1']

>>> r = create_table('test2')
>>> print r.http_response.status
Created

>>> list_tables()
['test1', 'test2']

>>> nr = nextrow()
>>> nr.next()
'r0'

>>> d = {'name':'jon','age':52,'dt':System.DateTime.Now}
>>> r = insert_entity('test2',pk,nr.next(),d)
>>> print r.http_response.status
Created

>>> for i in range(10):
...   d = {'name':'jon','count':i}
...   r = insert_entity('test2',pk,nr.next(),d)
...   print r.http_response.status
...
Created
...etc...
Created

>>> r = query_entities('test2','count gt 5')
>>> len(r.response)
4

>>> for dict in r.response:
...   print dict
Dictionary[str, object]({'PartitionKey' : 'partkey1', 
  'RowKey' : 'r10', 'Timestamp' : 
  <System.DateTime object at 0x000000000000002E 
  [2/17/2009 12:37:54 PM]>, 'count' : 6, 'name' : 'jon'})
Dictionary[str, object]({'PartitionKey' : 'partkey1', 
  'RowKey' : 'r11', 'Timestamp' : 
  <System.DateTime object at 0x000000000000002F 
  [2/17/2009 12:37:55 PM]>, 'count' : 7, 'name' : 'jon'})
...etc...

>>> for dict in r.response:
...   print dict['count']
6
7
8
9

>>> for entity in sort_entities(r.response,'count','desc'):
...   print entity['count']
9
8
7
6

>>> r = update_entity('test2',pk,'r13',{'name':'doug','age':17})
>>> r = query_entities('test2','age eq 17')
>>> print r.response[0]['name']
doug

>>> r = merge_entity('test2',pk,'r13',{'sex':'M'})
>>> r = query_entities('test2','age eq 17')
>>> print r.response[0]['name']
doug
>>> print r.response[0]['sex']
M

>>> r = query_entities('test2', "sex eq 'M'")
>>> r.response.Count
1
>>> r.response[0]['RowKey']
'r13'

>>> r = delete_entity('test2',pk,'r13')
>>> r = query_entities('test2', "sex eq 'M'")
>>> r.response.Count
0

>>> r = query_entities('test2',"dt ge datetime'2009-02-16'")
>>> r.response.Count
1
>>> r.response[0]
Dictionary[str, object]({'PartitionKey' : 'partkey1',
 'RowKey' : 'r2', 'Timestamp' : 
  <System.DateTime object at 0x000000000000005F 
  [2/17/2009 12:34:29 PM]>, 'age' : 52, 'name' : 'jon', 
  'dt' : <System.DateTimeobject at 0x0000000000000060 
  [2/17/2009 7:33:53 AM]>})

>>> r = query_entities('test2',"dt ge datetime'2010'")
>>> r.response.Count
0

Time, space, and data

Yesterday David Stephenson interviewed me for the book he is was to be writing with Vivek Kundra who is currently Washington DC’s CTO and reportedly the next Office of Management and Budget administrator for e-government and information technology.

Back in 2006 I learned from DC’s previous CTO, Suzanne Peck, and from Dan Thomas, about their plan to publish operational data in the service of transparency and accountability. At the time, I hoped this effort would show how ordinary citizens, as well as journalists, could be empowered to ask and answer questions like:

Do people in poor neighborhoods wait longer for service requests to be handled?

Talking with David yesterday, I struggled to come up with examples where the online publication and visualization of public data supports that kind of analysis. The best one I’ve seen lately comes from Eric Rodenbeck’s talk at ETech.

Eric’s company, Stamen Design, created Oakland Crimespotting. And yes, it’s another in a long line of mashups that spray crime data onto a Google Maps (or, in this case, Virtual Earth) display. But here’s the part of Eric’s talk that really got my attention:

There were no prostitution arrests for about a month. Then one day the cops started at one end of San Pablo Avenue, and you can watch them moving up the street and making arrests.

It wouldn’t have occurred to a citizen, or to a reporter, to ask the question:

Have the cops decided to crack down on prostitution?

Here the policy decision to conduct a sweep emerges from the data. There are two crucial enablers. First, the use of a map as a query interface. That’s common. But second, the use of animation to observe flows of data in time as well as in space. That’s still much rarer.

In the software community there’s vigorous debate about whether we need to rely on plugins like Flash and Silverlight to animate data in ways that enhance its analysis. My answer: It depends. Clearly much can already be done, and more will be done, with the basic web platform: browsers operating in an increasingly rich ecosystem of web services. Look at how the Rocky Mountain Institute uses animation to tell a story about US oil imports much more effectively than my static presentation was able to do. And like Stamen’s Oakland Crimespotting animation, the RMI’s oil import animation doesn’t use any plugins.

But we’re facing critical challenges, and we’ll want to deploy all the power tools we can lay our hands on. To that end, my colleagues at MIX Online have just released Project Descry, a set of four Silverlight-based visualizations. In an introductory article I wrote:

The world we must make sense of now is one in which human actions have planetary effects. The good news is that we can, for the first time, begin to measure those effects. We’re instrumenting the atmosphere and the oceans, and torrents of data are arriving from our sensors. The bad news is that we’re not yet very skillful storytellers in the medium of data. That’s true both in the specialized realm of science, and more broadly at the intersection of science, public policy, and the media.

If you’re a developer and are curious about how to create, for example, a treemap widget in Silverlight, you can visit Descry on CodePlex and have a look.

There are all kinds of useful tools yet to be built — in a variety of ways — and made available to citizens of the Net. I’m particularly interested in general-purpose visualizers, like the excellent ones at Many Eyes, that non-programmers can pour data into and make productive use of.

Where, for example, is the general-purpose visualizer for map data over time? In the spirit of Many Eyes, I’d like anyone to be able to upload a simple comma-separated dataset and create an animation like FlowingData’s Growth of Target, 1962 – 2008.

Ideally, the visualizer would also provide a scrollbar for scrubbing along the timeline. In the FlowingData example, you can do a geographic query by zooming and panning. But once you have selected a region you have to play the whole animation. Add timeline scrolling, and you can combine temporal with spatial query.

What other kinds of general-purpose visualizers do you imagine having and using?

A conversation with Andy Singleton about distributed software development

In a 2003 InfoWorld story on the globalization of software development I asked Andy Singleton to share his thoughts on distributed software development. He has continued to refine and reflect on his approach, which he says is inspired by the open source, agile, and web 2.0 movements. On this week’s Innovators podcast, Andy summarizes the often counter-intuitive methods that work well for him and his teams. They include:

Don’t interview. Just pay people to join a project, pull a task from the queue, and find out what they can do.

Don’t divide work geographically. You’re not making best use of your distributed team if you impose that artificial constraint.

Don’t do phone conference calls. “I’ve never had someone tell me: ‘I worked on a project with lots of conference calls, and it worked great, so your thesis is disproved.'”

Don’t estimate. It’s just extra work. If you know your tasks and priorities, go after them in order. Estimation won’t help, and will cost 10% of your time.

Pile on developers early. It enables people to self-sort, and yields a stronger and more flexible team at the two-week mark.

Ironically, Andy says, many proponents of agile software development resist the notion of distributed development:

They think everybody should meet once a day. That’s such a cop-out! Since most development nowadays is distributed, they’re saying that 90% of the people who should be taking advantage of agile methodologies can’t do it. What they really should be doing is figuring out how to make distributed teams at least as productive as colocated teams. And in our case, we believe they’re more productive because we’re bringing in better talent.

One of the key enablers of effective distributed work is a common event stream to which everyone can subscribe. To that end, the Assembla website has embraced web hooks. So, for example, the action of committing code to a repository implicitly fires an event. You can make that explicit by wiring the event to an action, like sending a Twitter direct message.

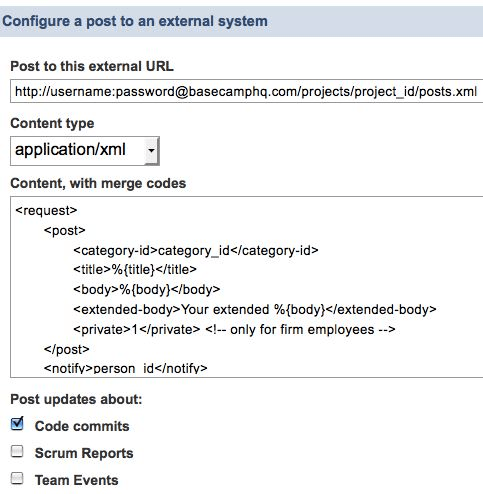
This is a really important idea. Today, most of the services that you’d like to weave together to enhance distributed teamwork don’t export event hooks. But it’s quite simple to do. Here’s how Assembla enables you to relay events to Basecamp:

It takes two to do this tango. The external system, in this case Basecamp, has to be prepared to catch an incoming REST call. And Assembla has to enable its users to wire internal events to outbound REST calls.

Neither requirement is difficult. And the payoff can go way beyond the basic pub/sub notification scenario shown here, as noted in the Web Hooks blog:

Thanks to CGI we got the read-write web, but we also made the web way more useful than it was intended. Suddenly browsing to a URL would run some code. And code…well, code can do anything.

Yes. That said, simple notification is nothing to sneeze at. That alone, widely implemented, would be a game changer.

The iCalendar validation project

Last month, in a series of entries, I laid out the case for an effort — inspired by the RSS/Atom feed validator — to create a similar suite of tests and tools for iCalendar feeds.

I’m delighted to report that two developers of libraries that support iCalendar are collaborating to do just that. Ben Fortuna is the author of iCal4j, which powers the best currently-available online iCalendar validator. And Doug Day is the author of DDay.iCal, a C# iCalendar library. Both iCal4j and DDay.iCal are open source projects.

They’re collaborating, at icalvalid.wikidot.com, on a platform-neutral suite of tests that can serve as foundation for a more robust iCalendar validation service.

As Sam Ruby points out:

For each of the red entries on that page, somebody needs to identify what should be tested for, and for each test identify a short message, an explanation, and a solution. Identifying real issues that prevent real feeds from being consumed by real consumers and describing the issue in terms that makes sense to the producer is what most would call value.

We’ve made a start on the wiki. As I proceed with my calendar aggregation project, I’ll continue to document the validation issues I run into. Meanwhile, in the spirit of loosly-coupled collaboration, please feel free to attach the tag icalvalid to any blog posting, forum message, or other online item that discusses iCalendar feeds that fail to validate, explores reasons why, and recommends solutions.

A conversation with Phil Long about teaching and learning

On this week’s Innovators podcast I spoke with Phil Long. He runs the newly-formed Center for Educational Innovation and Technology (CEIT) at the University of Queensland, in Australia. Phil is a transplant from MIT, where he was closely involved in the TEAL (technology-enhanced active learning) project. TEAL was the subject of a recent New York Times story: At MIT, Large Lectures are Going the Way of the Blackboard.

Born of John Belcher’s frustration that his large physics lectures were drawing fewer and fewer students each year, the TEAL experience mixes lecture segments with realtime interactive feedback (“clickers”) and guided teamwork.

Although the word technology is embedded in both TEAL and CEIT, it’s worth noting that sociology belongs there too. As Tim Fahlberg pointed out when I interviewed him about mathcasts and clickers, the technology that enables teachers to conduct realtime quizzes –and thereby adapt presentations on the fly — isn’t only about efficient measurement of what you could gauge roughly by a show of hands. The responses gathered by clickers are anonymous, and that makes all the difference. Nobody wants to raise a hand when asked: “Who didn’t understand that?”

Team formation is another area where technical and social engineering can usefully converge. If you test students before a course starts, Phil says, you can use that data to divide them into groups. But what heuristic should apply? He advocates teams of three drawn from the low-, middle-, and high-scoring groups. That arrangement encourages the most knowledgeable students to help teach their peers, and in so doing reinforce their own knowledge.

Phil points out that TEAL has so far been applied only in the domain of physics, where it has benefited from a wealth of research data about how students learn physics concepts. Part of CEIT’s mission will be to find ways to map the TEAL approach to other scientific domains, and also more broadly.

Alternative logging for Azure services

Some people say that cloud services are just web services rebranded. Since I’ve always defined web services inclusively, I tend to agree. But I do think that the emerging notion of cloud computing leads us toward greater abstraction of resources. And as I build out the Azure service described in this series, one of the resources I’m abstracting more than ever is the file system.

I’ve built online services for many years, and have always been aggressive about logging everything they do. Detailed logs assure me that things are working well, or help me figure out why they’re not.

My services have always done logging in the grand Unix tradition: They append lines of text to log files. I probe those files using tools like tail (to peek at the end) and grep (to search).

You can’t do things that way in the Azure cloud. True, the default logging mechanism writes to blobs, which are the moral equivalent of named files containing arbitrary streams of bytes. But your service can’t just open the log and append to it. Instead it calls a method, RoleManager.WriteToLog, that sends a message to the log. And in order to peek at the most recent entries, or search the log, you have to download one or more quarter-hourly blobs, then parse the XML records inside them.

So instead I’m using a cloud database. Or actually, three of them. One is Amazon’s SimpleDB, the second is the SQL Server-based SQL Data Services, and the third is Azure’s table storage. I figure my service will generate a lot of real data over the long haul, and it’ll be interesting to compare these services as they evolve and grow — and as the types and quantities of data I’m logging grow along with them.

In all three cases my pattern is the same. For each service, I’m wrapping a thin C# library around the HTTP/REST interface. The existing wrappers I’ve found, for Azure and SQL Data Services in particular, tend to hide the HTTP/REST interfaces. But I want to be able to see and touch them.

When I’m developing software that relies on a web-based infrastructure service, I want to be able to access that service in as many ways as I can. When I get stuck I can drop down to the HTTP level, and there I can triangulate on a problem in many complementary ways: from the command line using curl, from Python, from C#, from an HTTP sniffer.

Another pattern common to all three logging mechanisms is mixed use of statically- and dynamically-typed languages. Although I’ve written these interface libraries in C# in order to deploy on Azure, I use them from both C# and Python. When my Azure-based service logs its activities, it invokes the structured-storage interfaces from C#. But I invoke the same interfaces from IronPython to view, query, and analyze the logs. And if IronPython becomes a service provider on the Azure platform, as I hope it will, I’ll invoke the same interfaces again to write, as well as read, the logs created by those services.

So, for example, the current version of my SQL Data Services interface library is here. (Corresponding tests here.)

This is the method that writes a log message:

public static void sds_write_log_message(string type, string message, 
    string data)
  {
  var dt = Utils.XsdDateTimeFromDateTime(DateTime.Now);
  sds_flex_entity[] entities =
    {
    new sds_flex_entity("type","string",type),
    new sds_flex_entity("message","string",message),
    new sds_flex_entity("datetime","dateTime",dt),
    new sds_flex_entity("data","string", data != null ? data : "")
    };
 
string id = "id_" + System.DateTime.Now.Ticks.ToString();
var sr = create_entity("elmcity","events", "Event", id, entities);

And here’s create_entity which invokes the REST API:

public static sds_response create_entity(string authority, 
    string container, string entityname, string entityid, 
    sds_flex_entity[] entities)
  {
  byte[] payload = make_sds_entity_payload(entityname, entityid, 
    entities);
  var response = DoSdsRequest(authority, container, null, "POST", 
    payload);
  return get_sds_response(response, false, entityname, null, null);
  }

The container for this set of records is called events, and it lives in an authority called elmcity, so the request URI will be https://elmcity.data.database.windows.net/v1/events, and the body of the HTTP POST request will look like this:

<s:Event xmlns:s='http://schemas.microsoft.com/sitka/2008/03/'>
<s:Id>id_012345</s:Id>
<type xsi:type='x:string'>exception</type>
<message xsi:type='x:string'>DoHttpRequest: ProtocolError</message>
<datetime xsi:type='x:dateTime'>2009-01-29:T12:42:01</datetime>
<data xsi:type='x:string'>400 Bad Request</data>
</s:Event>

Here’s the method that queries a container and returns a package of results:

public static sds_response query_entities(string authority, 
    string container, 
  bool in_ns, string entity, List<string> entitynames, string query)
  {
  var response = DoSdsRequest(authority, container, query);
  return get_sds_response(response, in_ns, entity, entitynames, null);
  }

In the current version of the SQL Data Services query syntax, here’s how you ask for recent log entries:

from e in entities 
  where e["datetime"] >= "2009-01-29:T14:00:00" 
  orderby e["datetime"] ascending 
  select e

Here’s the method to transmit that query to SQL Data Services:

public static sds_response query_entities(string authority, 
    string container, bool in_ns, string entity, 
    List<string> entitynames, 
    string query)
  {
  var response = DoSdsRequest(authority, container, query);
  return get_sds_response(response, in_ns, entity, entitynames, null);
  }

The HTTP request again goes to https://elmcity.data.database.windows.net/v1/events, but this time it’s a GET not a POST, and the full URI ends with “?q=” plus the “from e in entities…” query from above.

The HTTP response is a sequence of XML packets like the <Event>...</Event> example shown above, filtered and ordered by the query. The query_entities method transforms those into a list of name/value collections.

That list of collections is accessible from C# code running inside the Azure service, but equally accessible from IronPython running outside Azure. Here’s an IronPython script that finds events logged within the last 2 hours whose error messages contain ‘400’:

import clr
clr.AddReference("CalendarAggregator")
from CalendarAggregator import *
import System

sds = SdsStorage()

flexentities = ('type','message','datetime','data')
_flexentities = System.Collections.Generic.List[str](flexentities)

dt = System.DateTime.Now
dt_diff = System.TimeSpan.FromHours(2)
dt_str = Utils.XsdDateTimeFromDateTime( dt - dt_diff )

q = 'from e in entities where e["datetime"] >= "%s" orderby \
      e["datetime"] ascending select e' % dt_str

sr = SdsStorage.query_entities("elmcity","events", False, \
  "Event", _flexentities, q )

results = filter ( lambda x: x['data'].startswith('400'), sr.response )

for d in results:
  print d['type'],d['message'],d['datetime'], d['data']

The details of the SQL Data Services query syntax aren’t important here. What matters is the strategy:

  1. Make a thin wrapper around the REST interface to the query service
  2. Use the available query syntax to produce raw results
  3. Capture the results in generic data structures
  4. Refine the raw results using a dynamic language

You can use this strategy with any of the emerging breed of cloud databases.

A conversation with Andy Boutin about Pellergy’s oil-to-pellet furnace retrofit

My guest for this week’s Innovators podcast is Andy Boutin. I first heard from Andy when he made this comment on my December 2007 entry about biomass heating. Then his name came up again in my conversation with Jock Gill. Clearly I had to interview Andy too.

His method of retrofitting an oil furnace with an alternative pellet combustion system will be of special interest to a certain number of folks in the northeastern United States. But the pragmatic systems engineering approach that he took is a model for a lot of other innovations that can, and will, move us forward in the years to come. Yankee ingenuity is about to make a major comeback, and not a moment too soon.

Unifying HTTP success and failure in .NET

In an earlier installment of the azure+elmcity series I griped about some inconsistencies in how the .NET Framework deals with HTTP:

The .NET equivalent to Python’s httplib, for example, is the HttpWebRequest/HttpWebResponse pair. But these APIs differ from those provided by httplib in a couple of ways that annoy me.

First, there’s an inconsistency in the way headers are handled. You get and set most headers using the Headers collection. But you get and set a few special ones, like Content-Type and Content-Length, using special named properties.

Second, status codes are handled inconsistently. Most responses return status codes. But for codes in the 4xx series, an exception is thrown.

To me these behaviors are quirks that make it trickier to use RESTful interfaces.

The exceptions, in particular, make it much harder to write tests. When I test the method that puts a blog into the Azure blob store, for example, I expect success, and here’s how I express that expectation:


Assert.AreEqual(HttpStatusCode.Created, response.normal_status);

But when I test the method that creates a public container, I expect failure if the container already exists. Here’s how I express that expectation:


Assert.AreEqual(WebExceptionStatus.ProtocolError, response.exception_status);

In order to deal with successes and failures in uniform way, I created an http_response_struct that encapsulates both, and a method that performs a web request and returns a structure of that type.

The code, in its current form, appears below. I present it here for two reasons. First, because it may be of value to others. But second, because others have surely done this in better and more general ways. I’m hoping this entry will attract pointers to some other simple but effective implementations of this idea.


public struct http_response_struct
  {
  public HttpStatusCode normal_status;
  public WebExceptionStatus exception_status;
  public string message;
  public byte[] data;
  public string data_as_string;
  public Dictionary<string, string> headers;

  public http_response_struct(HttpStatusCode normal_status, 
      WebExceptionStatus exception_status, string message, byte[] data, 
      string data_as_string, Dictionary<string, string> headers)
    {
    this.normal_status = normal_status;
    this.exception_status = exception_status;
    this.message = message;
    this.data = data;
    this.data_as_string = data_as_string;
    this.headers = headers;
    }
  }


public static http_response_struct DoHttpWebRequest(HttpWebRequest request, 
    byte[] data)
  {
  request.AllowAutoRedirect = true;
  HttpStatusCode normal_status;
  WebExceptionStatus exception_status;
  string message = "";
  request.ContentLength = 0;
  Dictionary<string, string> headers = new Dictionary<string, string>();

  if (data != null && data.Length > 0)
    {
    request.ContentLength = data.Length;
    var bw = new BinaryWriter(request.GetRequestStream());
    bw.Write(data);
    bw.Flush();
    bw.Close();
    }

  byte[] return_data = new byte[0];
  string return_data_as_string = "";

  try
    {
    HttpWebResponse response = (HttpWebResponse)request.GetResponse();
    normal_status = response.StatusCode;
    exception_status = new WebExceptionStatus();
    message = response.StatusDescription;
    foreach (string key in response.Headers.Keys)
      headers[key] = response.Headers[key];
    get_response_data(request, ref return_data, ref return_data_as_string, 
      response);
    response.Close();
    }
  catch (WebException e)
    {
    exception_status = e.Status; 
    normal_status = new HttpStatusCode();
    message = string.Format("{0} {1}", exception_status.ToString(), 
      e.Message);
    get_response_data(request, ref return_data, ref return_data_as_string, 
      (HttpWebResponse) e.Response);
    string logmsg = string.Format("DoHttpRequest ({0}): {1}", request.RequestUri, 
      message);
    write_log_message(logmsg);
    }

  return new http_response_struct(normal_status, exception_status, 
    message, return_data, return_data_as_string, headers);
  }

Transparency data in motion

I wondered how the Transparency International data I visualized here (and also discussed here) would behave in a GapMinder-style animation. So I poured the data into a Google motion chart. You can check out the results here.

As I mentioned the other day, one of the notable anomalies in this dataset is Georgia. Among countries whose CPI (Corruption Perception Index) rankings are most volatile (according to TI), it stands out as a hopeful data point moving in the right direction.

In these two frames, you can see Georgia pulling away from its neighbors between 2004 and 2008.

The motion chart is an interesting way to observe the anomaly, but I didn’t find it to be a useful way to discover it. In the earlier example, I made a stack of sparklines, sorted by volatility, and then eyeballed the trends looking for exceptions.

To approximate that method using the motion chart, I started with this view:

Plotting volatility against itself produces the same sorted view I had in my spreadsheet. I figured I’d select the cluster of most-volatile countries, then watch them bubble up and down. But the points overlapped too much to select all the ones I wanted.

Next I plotted volatility against rank, which doesn’t really make sense but had the effect of spreading out the points so I could select more of them:

That helped a bit, but I still couldn’t easily grab, e.g., the most-volatile third of the list.

Does this mean that motion charts work better for displaying patterns than for discovering them? Not necessarily. I think it all depends on the data, the patterns you think you’re looking for, and the patterns you don’t know you’re looking for. With more lenses — and more easily interchangeable lenses — our exploratory and explanatory powers will grow.

A conversation with Bob Jennings about new ways to heat with wood

On this week’s podcast I spoke with Bob Jennings, an engineer who specializes in alternative heating systems. In his view, the sun and the forests are major sources of practical renewable energy for New England’s near future. He designs and installs solutions based on solar hot water, and also on wood gasification boilers like the one whose installation and use I described here.

Most experts agree that we’ll need to replace oil with a mix of renewable sources. In regions where wood biomass is an important ingredient in that mix, we’ll need modern technologies that burn the stuff cleanly and efficient. Bob Jennings reflects on existing and emerging options: pellet stoves, pellet boilers, and wood gasification boilers.

SOA: Slouching towards Bethlehem

I’m providing COBRA Continuation Health Coverage to a family member who’s no longer eligible under my company health insurance plan. Three months ago I signed up for the plan, and separately arranged for automatic payment.

Yesterday I was notified that the administration of this COBRA continuation service was sold by one company and bought by another. So of course, now I have sign up again, and arrange for automatic payment again.

Really?

This is how I know that SOA (service-oriented architecture) is not dead, but rather slouching towards Bethlehem to be born.

Yesterday’s call:

Agent: You’ll need to log in to the website and then, using the account number and PIN in the letter we sent …

Me: Hold on a second. I didn’t ask company A to sell the administration of service B to company C. I don’t even want to know that it happened. I only care that the health coverage continues, and that A — excuse me, C — gets paid. I shouldn’t have to create any new online accounts. But I have the sinking feeling that I will have to.

Agent: Yes, sir, I’m afraid you will.

A service handoff like this could be, and should be, nearly transparent to the customer. It’s doable. But it will require a few layers of secure intermediation and delegation. Call it SOA, call it whatever you like. But so long as we keep having these inane conversations, don’t call it dead.

Transparency trends (continued): A data-wrangling tale

As promised yesterday, here’s a detailed account of the gymnastics required to extract usable data from Transparency International’s Corruption Perception Index (CPI) reports.

The reports are published as yearly editions for each of the 11 years since 1998. They’re not consolidated, at least not anywhere I can find, so if you want to analyze trends in the TI data you’ve got to consolidate those reports yourself.

The yearly reports are available as both HTML tables and corresponding Excel spreadsheets. I didn’t know about the latter. The website is organized such that for the recent years I examined first, only the HTML table is obviously available. So the procedure I’ll show here wasn’t strictly necessary. I could have gone straight to the Excel files.

But in the end it’s the same data, and all the subsequent processing is necessary in either case. So I’ll take this opportunity to show how to use Excel to extract data from an HTML table. That’s a really common operation if you’re into this sort of thing, and Excel does it pretty well.

Here’s part of the 2005 CPI table:

TI 2005 Corruption Perceptions Index

Country rank Country 2005 CPI score Confidence range Surveys used***

1

Iceland 9.7 9.5 – 9.7 8
2 Finland 9.6 9.5 – 9.7 9
New Zealand 9.6 9.5 – 9.7 9
4 Denmark 9.5 9.3 – 9.6 10

To import it into Excel 2007, first visit the page and capture its URL.

Then, in Excel, do Data -> From Web -> From Web (Classic Mode), navigate to the table you want, click the arrow at its top left corner, and click Import.

That was the easy part. Before long, I had a spreadsheet with 11 CPI reports. To simplify things, I stripped each one down to just two columns: country name and CPI rank. I wanted to see trends in the ranking over time. To do that, I needed to merge the 11 sheets into a single sheet with a column of normalized names, and 11 columns of normalized ranking data.

The names had to be normalized for a couple of reasons. First, there were six different encodings of Côte d´Ivoire:

C\xC3\xB4te d\xC2\xB4Ivoire
Cote d'Ivoire
C\xF4te-d'Ivoire
Cote d\xB4Ivoire
Cote d?Ivoire
C\xF4te d\xB4Ivoire

There were also typos (Moldovaa for Moldova) and variant spellings (USA vs United States)

The rankings had to be normalized because sometimes countries are tied for a rank. In those cases (as above) some of the files were sparse, with empty cells for repeated ranking. In other cases, all cells were populated.

To do this normalization I exported the data from Excel to 11 CSV files, and used the following Python script:

import csv

r98 = csv.reader(open('cpi1998.csv'))
r99 = csv.reader(open('cpi1999.csv'))
r00 = csv.reader(open('cpi2000.csv'))
r01 = csv.reader(open('cpi2001.csv'))
r02 = csv.reader(open('cpi2002.csv'))
r03 = csv.reader(open('cpi2003.csv'))
r04 = csv.reader(open('cpi2004.csv'))
r05 = csv.reader(open('cpi2005.csv'))
r06 = csv.reader(open('cpi2006.csv'))
r07 = csv.reader(open('cpi2007.csv'))
r08 = csv.reader(open('cpi2008.csv'))

def fix(c):
  c = c.replace('(Former Yugoslav Republic of)','')
  c = c.replace('Congo, Republic of','Congo, Republic')
  c = c.replace('Congo, Republic the','Congo, Republic')
  c = c.replace('Dominican Rep.','Dominican Republic')
  c = c.replace('Dominican Rep\n','Dominican Republic\n')
  c = c.replace('FYR ','')
  c = c.replace('Saint Vincent and the','Saint Vincent')
  c = c.replace('Saint Vincent and','Saint Vincent')
  c = c.replace('Macedonia ','Macedonia')
  c = c.replace('Moldovaa','Moldova')
  c = c.replace('Serbia and Montenegro','Serbia')
  c = c.replace('Palestinian Authority','Palestine')
  c = c.replace('the Grenadines','Grenadines')
  c = c.replace('&','and')
  c = c.replace('USA','United States')
  c = c.replace('Viet Nam','Vietnam')
  c = c.replace('Slovak Republic','Slovakia')
  c = c.replace('Kuweit','Kuwait')
  c = c.replace('Taijikistan','Tajikistan')
  c = c.replace('Republik','Republic')
  c = c.replace('Herzgegovina','Herzegovina')
  c = c.replace("Ivory Coast",'C\xC3\xB4te d\xC2\xB4Ivoire')
  c = c.replace("Cote d'Ivoire",'C\xC3\xB4te d\xC2\xB4Ivoire')
  c = c.replace("C\xF4te-d'Ivoire", 'C\xC3\xB4te d\xC2\xB4Ivoire')
  c = c.replace('Cote d\xB4Ivoire', 'C\xC3\xB4te d\xC2\xB4Ivoire')
  c = c.replace('Cote d?Ivoire', 'C\xC3\xB4te d\xC2\xB4Ivoire')
  c = c.replace('C\xF4te d\xB4Ivoire', 'C\xC3\xB4te d\xC2\xB4Ivoire')
  return c

d = {}
rnum = -1
lastrank = None

for reader in [r98,r99,r00,r01,r02,r03,r04,r05,r06,r07,r08]:
  rnum += 1
  for row in reader:
    rank = row[0]
    if rank == '':         # normalize rank
      rank = lastrank
    lastrank = rank
    country = fix(row[1])  # normalize name
    if not d.has_key(country):
      d[country] = [0,0,0,0,0,0,0,0,0,0,0]
    d[country][rnum] = rank
   
keys = d.keys()
keys.sort()

for key in keys:
  print "%s\t%s\t%s\t%s\t%s\t%s\t%s\t%s\t%s\t%s\t%s\t%s" % 
    ( key, d[key][0],d[key][1],d[key][2],d[key][3],
           d[key][4],d[key][5],d[key][6],d[key][7],
           d[key][8],d[key][9],d[key][10] )

As you can see, the bulk of this script is really just data, in the form of search/replace pairs. Its output is another CSV file. It took me a few tries to reduce the list of names to a normalized core. I ran the script, took the output into Excel, eyeballed the list, and added new search/replace pairs.

Eventually I wound up with this data, which I brought back into Excel to explore. Because I wanted to look at what I’m calling volatility — that is, the variability in CPI rankings — I added a column that computes the difference between a country’s highest and lowest rankings over the 11-year period, and then sorts countries by that difference, from most to least volatile.

We can debate whether a stack of sparklines is a useful way to visualize trends in this data, but that’s the approach I decided to try. It gave me a chance to experiment with some of the sparkline kits available for Excel, and the one I settled on is BonaVista’s MicroCharts.

Here’s a picture of two chart styles I tried:

These microcharts do succeed in telling stories about each country individually, while also making it possible to notice that Georgia, atypically among the more volatile countries, is moving toward a lower (better) ranking.

In another variation on this theme, I flipped the rankings to their negative counterparts so that the charts would flip too, and would correspond to my natural sense that up means better and lower means worse. I also removed the zeroes so that they wouldn’t show up as data points.

That was good enough for my purposes, but when I converted the spreadsheet back to HTML I wasn’t happy with the results. That’s partly because the microcharts, which are rendered using TrueType fonts, had to be converted to lower-resolution images. And it’s partly because the HTML that Excel generated was too complicated for my WordPress blog to handle gracefully.

So I exported the enhanced data back out to a CSV file, and switched to Python again. There are a million ways to generate sparklines from data, but the one I remembered from a previous encounter was Joe Gregorio’s handy sparkline service.

(By the way, it should be possible to use that web-based service from Excel. And interactively, you can. If you capture a sparkline URL like this one, you can paste it into the File Open dialog presented by Excel’s Insert -> Picture feature. The dialog asks for a filename, but you can give it an URL and it’ll work.

When I realized that, I spent a few minutes trying to automate the procedure so that Excel 2007 could programmatically grab data, run it through an image-generating web service, and embed the resulting pictures. I failed, as have others before me, but it’s nifty idea. If you know the solution, please share.)

Anyway, here’s the little Python script that reads the data, produces sparkline images, and embeds them in the HTML table I displayed on my blog:

# -*- coding: utf-8 -*-
import urllib2,os

data = open('cpi.csv').read()

url_template = "http://bitworking.org/projects/sparklines/spark.cgi?\
  type=discrete&d=%s&height=20&limits=0,200&upper=1&\
  above-color=black&below-color=white&width=4"

rows = ''
row_template = """<tr>
<td class="sparkline">
<img src="http://jonudell.net/img/cpi/%s">
</td>
<td>%s</td></tr>\n"""

lines = data.split('\n')
for line in lines:
  country = line.split(',')[0]
  ranks = line.split(',')[1:]
  quoted_fname = '%s.png' % urllib2.quote(country)
  fname = '%s.png' % country
  imgurl = url_template % ranks
  cmd = 'curl "%s" > "./cpi/%s" ' % (imgurl,fname)
  os.system(cmd)
  cmd = 'mogrify -flip "./cpi/%s"' % fname
  os.system(cmd)
  rows += row_template % (quoted_fname,country.replace(' ','&nbsp;'))

html = '<table cellspacing="4">%s</table>' % rows
f = open('cpi.html','w')
f.write(html)

By specifying upper=1 and below-color=white in the sparkline-generating URL, the zeroes (representing unreported data) vanish from the charts.

The charts don’t include reference lines as shown in the Excel screenshot, but I added them back using this bit of CSS:

td.sparkline {
border-top:1px #cccccc solid;
}

I’m using Python here partly as a shell language. It invokes a pair of command-line utilities: cURL to download images, and mogrify (part of the ImageMagick suite) to flip them.

Although one of these commands is a cloud-based sparkline service, and the other is a locally-installed image processing program, they’re treated in exactly the same way. When the quantities of data involved are small — these .PNG images are just a few hundred bytes — there’s no discernible difference between the two modes. I like that symmetry.

What I don’t like is all the moving parts. It’s awkward for me to move from Excel to Python to Excel to Python, with excursions to the command line along the way, and no normal person would even consider doing that.

In a simple case like this, such gymnastics should never have been required. If you’re going to publish data to the web, assume that people will want to use it and do the minimal basic hygiene and consolidation.

At some point, though, people will want to do fancier tricks. Today you have to be a “data geek” to perform them, but that shouldn’t be so. We’ve got to find a way to integrate Excel, dynamic scripting, command-line voodoo, and web publishing into a suite of capabilities that’s much more accessible.