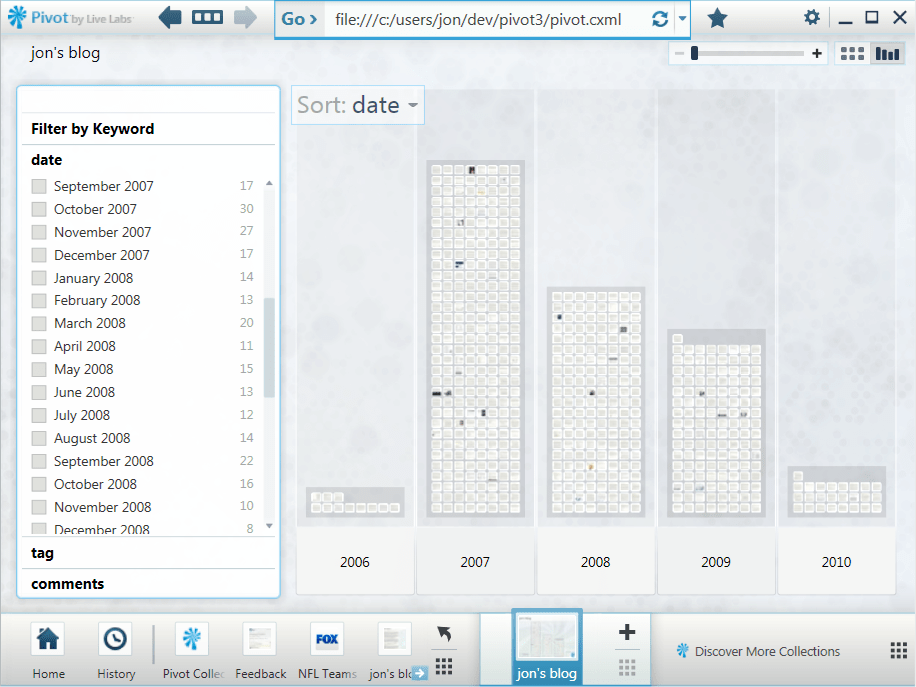
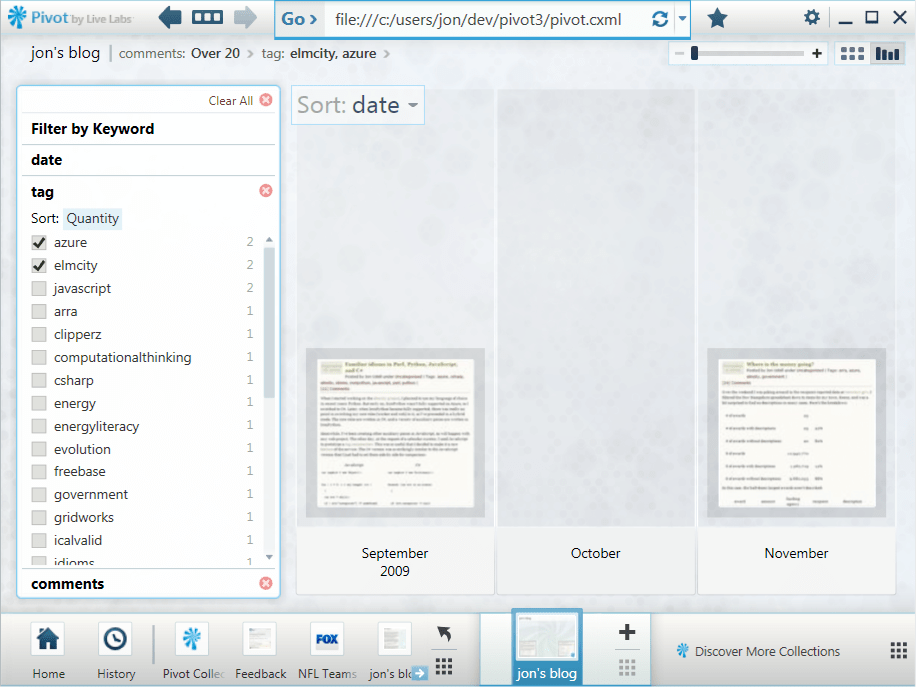
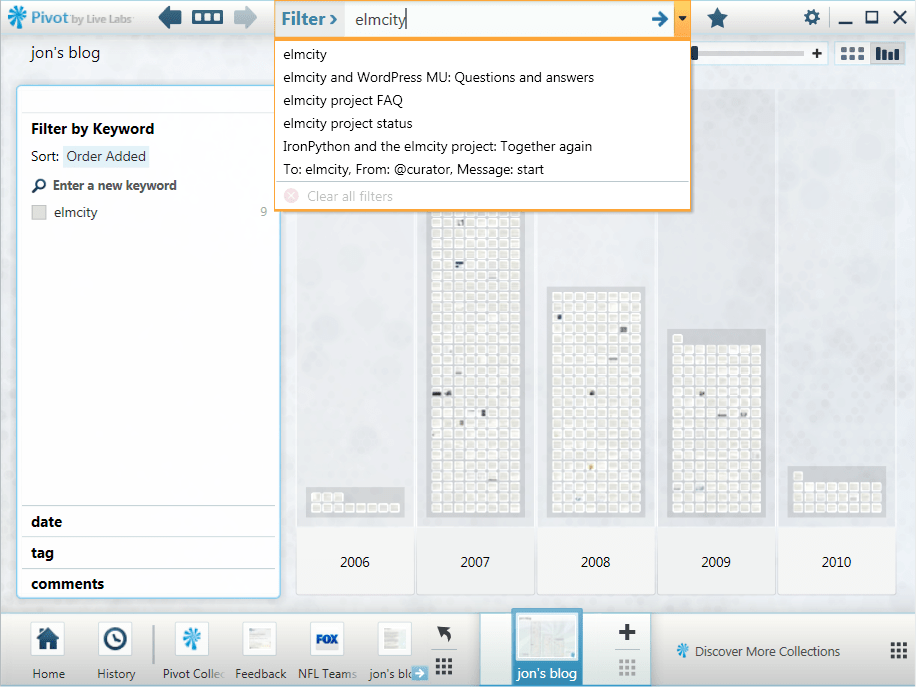
I’ve posted the Python script I used to make the Pivot visualization of this blog. I need to set it aside for now and do other things, but here’s a snapshot of the process for my future self and for anyone else who’s interested.
Using deepzoom.py to create Deep Zoom images and collections
I’m using this Python component to create Deep Zoom images and collections. I made the following changes to it:
1. tile_size=256 (not 254) at line 59, line 160, and line 224
2. source_path.name instead of source_path at line 291
3. destination + '.xml' instead of destination at line 341
Let’s assume that Python is installed, along with the Python Imaging Library, and that your current directory contains the files 001.jpg, 002.jpg, and 003.jpg:
001.jpg
002.jpg
003.jpg
For each image file, you could run deepzoom.py thrice from the command line, like so:
python deepzoom.py -d 001.xml 001.jpg
python deepzoom.py -d 002.xml 002.jpg
python deepzoom.py -d 003.xml 003.jpg
My script doesn’t actually do it that way, it enumerates JPEGs and instantiates deepzoom.py’s ImageCreator object once for each. But either way, for each JPEG you end up with a DZI (Deep Zoom Image) package that consists of (for 001.jpg):
- A settings file: 001.xml
- A subdirectory: 001_files
- More subdirectories (named 0, 1, etc.) inside 001_files
- JPG files inside those subdirectories
Now, in this case, the current directory looks like this (using -> to mark additions):
001.jpg
-> 001.xml
-> 001_files
002.jpg
-> 002.xml
-> 002_files
003.jpg
-> 003.xml
-> 003_files
To build a collection, do something like this in Python:
from deepzoom import *
images = ['001.xml','002.xml', '003.xml']
creator = CollectionCreator()
creator.create(images, 'dzc_output')
Now the current directory looks like:
001.jpg
001.xml
001_files
002.jpg
002.xml
002_files
003.jpg
003.xml
003_files
-> dzc_output.xml
-> dzc_output_files
The Pivot collection’s CXML file will refer to dzc_output.xml, like so:
<Items ImgBase="dzc_output.xml">
Using IECapt to grab screenshots
This tool uses Internet Explorer, so only works on Windows. There is also CutyCapt for WebKit, which I haven’t tried but would be curious to hear about.
Here’s an example of the IECapt command line I’m using:
iecapt –url=http://blog.jonudell.net/… –delay=1000 –out=tmp.jpg
The result in most cases is a tall skinny JPEG, because it renders the whole page — which can be very long — before imaging it. When I ran it over a 600-item collection, it hung a couple of times because of JavaScript errors. So I went to Internet Options->Browsing in IE, checked Disable script debugging, and unchecked Display a notification about every script error.
Using ImageMagic to crop screenshots
Here’s a picture of an image produced by IECapt, overlaid with a rectangle marking where I want to crop:
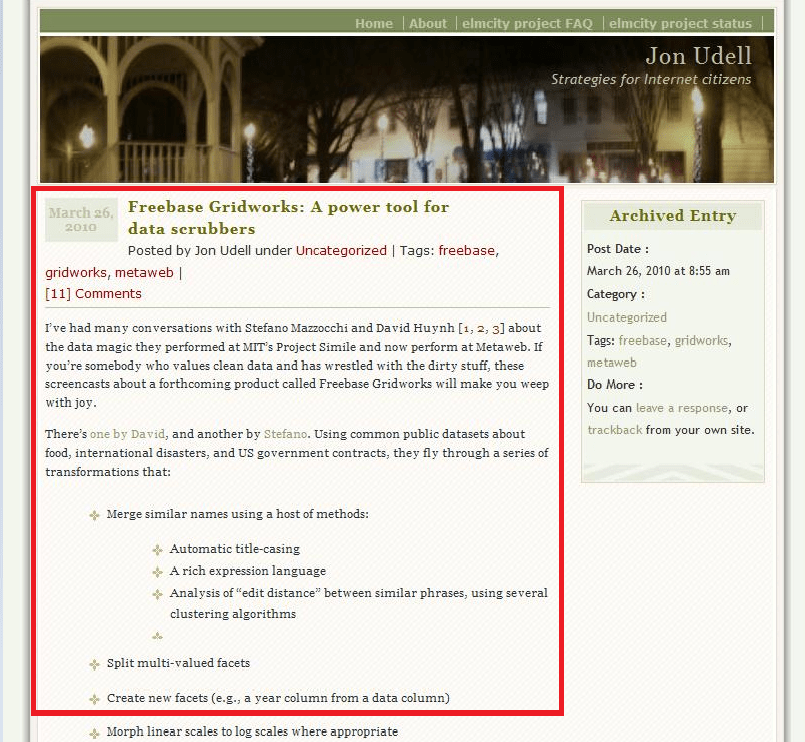
The rectangle’s origin is at x=30 and y=180. Its width is 530 pixels, and height 500. Here’s the ImageMagick command to crop a captured image in tmp.jpg into a cropped image in 001.jpg:
convert -quality 100 -crop 530×500+30+180 -border 1×1 -bordercolor Black tmp.jpg 001.jpg
I’m writing this down here mainly for myself. ImageMagic can do everything under the sun, but it always takes me a while to dig up the recipe for a given operation.
Parsing the WordPress export file
I found to my surprise that WordPress currently exports invalid XML. So the script starts with a search-and-replace that looks for this:
xmlns:wp="http://wordpress.org/export/1.0/"
And replaces it with this:
xmlns:wp="http://wordpress.org/export/1.0/"
xmlns:atom="http://www.w3.org/2005/Atom"
Then it walks through the items in the Atom feed, extracting the various things that will become Pivot facets. For the description, it tries to parse the content:encoded element as XML, and find the first paragraph element within it. If that fails, it just treats the element as text and grabs the beginning of it.
Weaving the collection
There are two control files that need to be synchronized. First, there’s dzc_output.xml, for the Deep Zoom collection. It has elements like this:
<I Id=”596″ N=”596″ Source=”2245.xml”>
Then there’s pivot.cxml which drives the visualization. It has elements like this:
<Item Id="596" Img="#596"
Name="Freebase Gridworks: A power tool for data scrubbers"
Href="http://blog.jonudell.net/2010/03/26/...
<Description><![CDATA[
I've had many conversations with Stefano Mazzocchi and David Huynh [1, 2, 3]
about the data magic they performed at MIT's Project Simile and now perform
at Metaweb. If you're somebody who values clean data and has wrestled with
the dirty stuff, these screencasts about a forthcoming product called
Freebase Gridworks will make you weep with joy.
]]></Description>
<Facets>
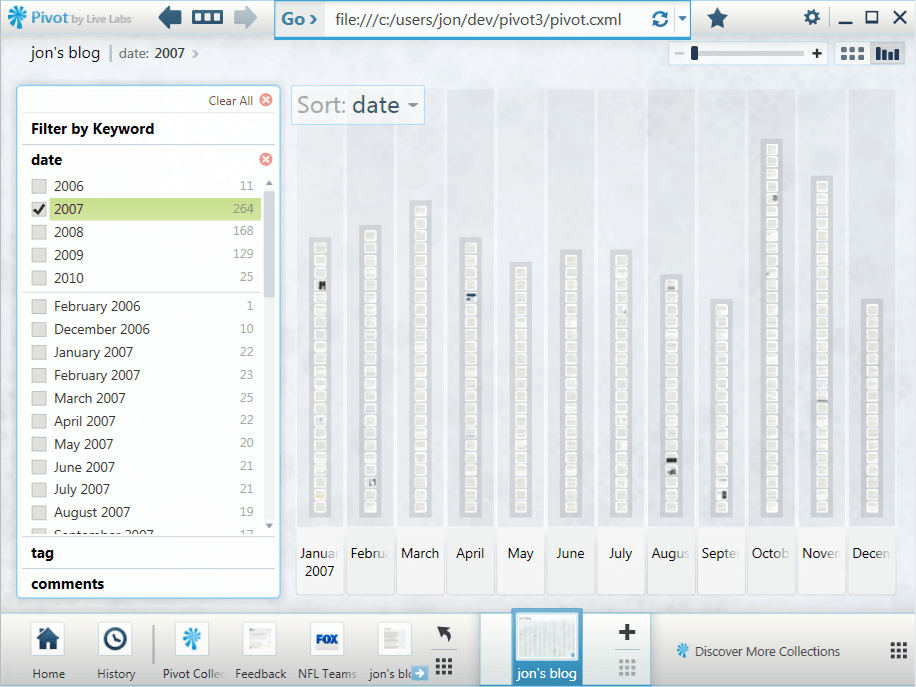
<Facet Name="date">
<DateTime Value="2010-03-26T00:00:00-00:00" />
</Facet>
<Facet Name="tag">
<String Value="freebase" />
<String Value="gridworks" />
<String Value="metaweb" />
</Facet>
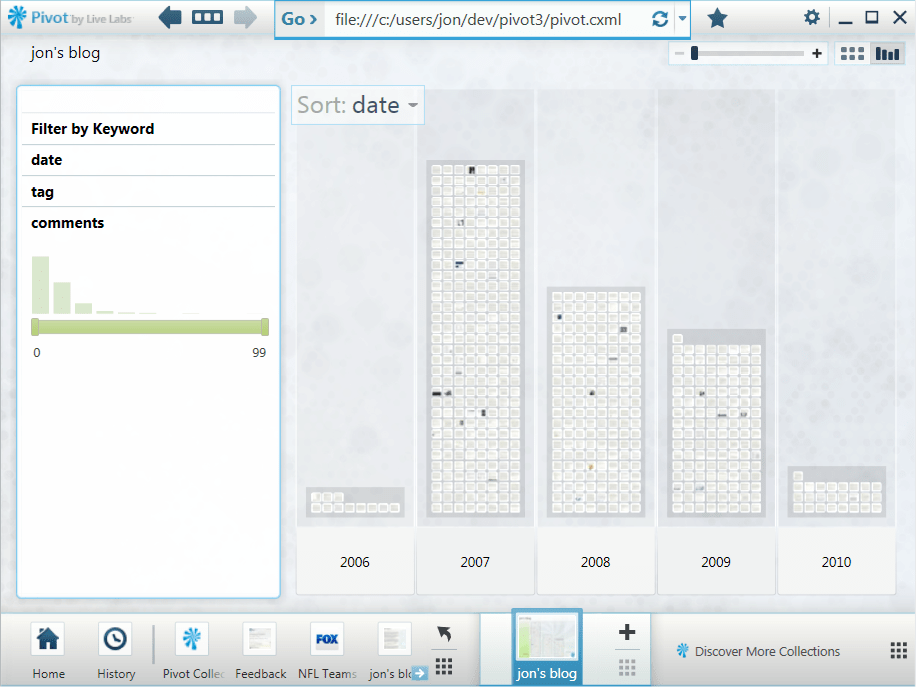
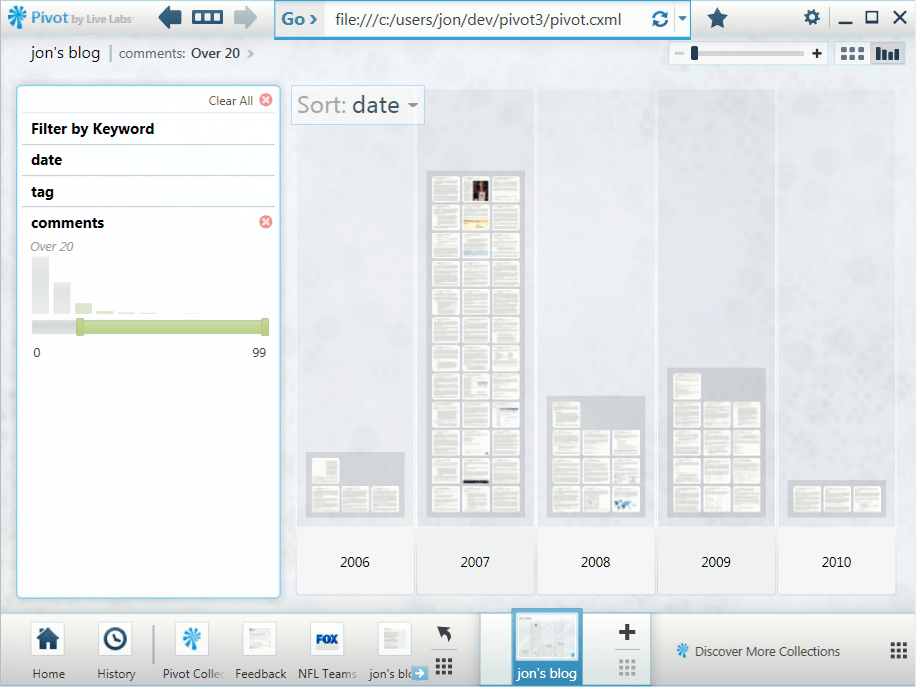
<Facet Name="comments">
<Number Value="24" />
</Facet>
</Facets>
</Item>
In this example, Source="2245.xml" in dzc_output.xml refers to a Deep Zoom image whose name comes from the WordPress post_id for that entry, which is:
<wp:post_id>2245</wp:post_id>
But Id="596", which is the connection between dzc_output.xml and pivot.cxml, comes from a counter in the script that increments for each item processed. I don’t know why the numbering of items in the WordPress export file is sparse, but it is, hence the difference.
Things to do
Here are some ideas for next steps.
1. Check the comment logic. I just noticed the counts seem odd. Maybe because I’m counting all comments instead of approved comments?
2. Use HTML Tidy to ensure that item content will parse as XML, and then count various kinds of elements within it: tables, images, etc.
2. Use APIs of various services — Twitter, bit.ly, etc. — to count reactions to each item.